Figures & data
Table 1 Demographic and Clinical Laboratory Data of Patients with Renal Cancer and Patients with Diabetic Nephropathy (Each Group n = 5)
Figure 1 The expression of VDR protein and autophagosomes are decreased in podocytes of diabetic patients. Kidney biopsy specimens were from patients with diabetic nephropathy (DN) and non-tumor renal tissue from patients with kidney cancer. (A) Representative pictures of periodic acid-Schiff (PAS) staining, anti-synaptopodin immunofluorescence (IF) and VDR immunohistochemistry (IHC). Bottom panels are enlarged images of the boxed areas in the middle panels. Arrows indicate VDR was mainly expressed in glomerular podocytes with nuclear staining. (B) Representative ultrastructural imagines showing autophagosomes in podocytes. Arrows indicate autophagosomes in podocytes. (C) Semi-quantitative measurement of VDR intensity in the glomeruli in each group. (D) Quantification of autophagosomes in podocytes. All results are presented as mean ± SEM, *P<0.05 considered statistically significant.
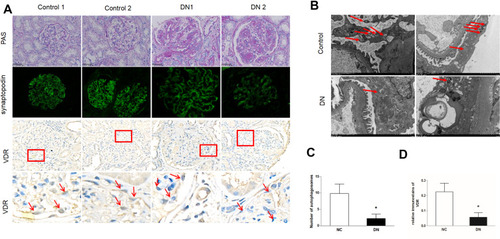
Figure 2 Calcitriol normalizes the expression of VDR expression in experimental diabetic nephropathy. SD male rats were intraperitoneally injected with 60 mg/kg streptozotocin. After 3 days, the rats with STZ treatment were garaged with 0.1μg/kg/d calcitriol or vehicle solution daily for consecutive 18 weeks. (A) Representative Immunohistochemical staining of VDR protein (400×) at 8th, 14th, 18th week in three groups. (B) Immunoblot analysis of VDR expression in the renal cortex at different time points in three groups, and β-actin was used as a loading control. (C) Quantification of VDR protein. Values are expressed as mean ± SD (n=6). Significance: *P<0.05 vs NC group, # P<0.05 vs DN group at the same time point, respectively.
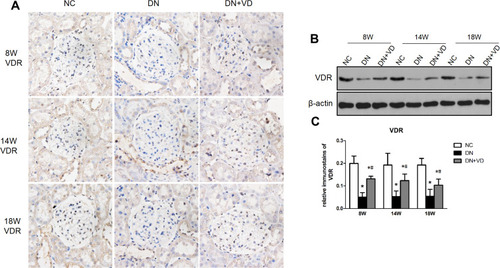
Table 2 KW/BW and Blood Biochemical Levels in Diabetic and Control Rats
Figure 3 Effects of calcitriol on blood glucose, body weight, urine volume and proteinuria in diabetic rats. SD male rats were intraperitoneally injected with 60 mg/kg streptozotocin. After 3 days, the rats with STZ treatment were garaged with 0.1μg/kg/d calcitriol or vehicle solution daily for consecutive 18 weeks. The body weight, 24h urine volume, 24h urinary protein and blood glucose levels were measured every 2 weeks. Time course monitoring of blood glucose (A), body weight (B), 24h urine volume (C) and 24h urinary albumin excretion (D) levels for 18 weeks. Values are mean ± SD (n=6). Significance: *P<0.05 vs NC group, # P<0.05 vs DN group at the same time point, respectively.
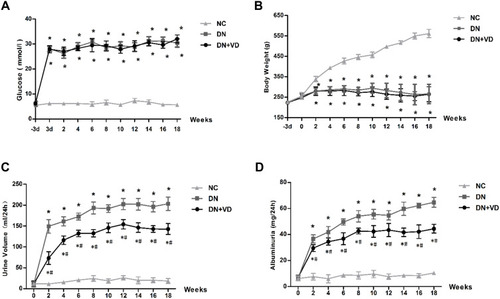
Figure 4 Calcitriol attenuates histological abnormalities of diabetic nephropathy. SD male rats were intraperitoneally injected with 60 mg/kg streptozotocin. After 3 days, the rats with STZ treatment were garaged with 0.1μg/kg/d calcitriol or vehicle solution daily for consecutive 18 weeks. Kidney tissues were collected for histology at 18th week. (A) Representative images of Periodic Acid-Schiff (PAS) staining, Masson staining and electron microscopy (EM) of three groups of kidney tissues. Arrows indicate the expanded mesangial matrix in glomerular area and arrowheads indicate the enhanced thickness of the glomerular basement membrane and podocyte effacement. (B) Glomerular mesangial matrix index (%) of three groups. (C) Quantifications of mean GBM thickness. Values are mean ± SD (n=6). Significance: *P<0.05 vs NC group, # P<0.05 vs DN group.
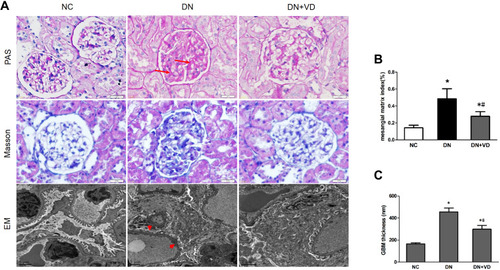
Figure 5 Calcitriol treatment preserved slit diaphragm proteins and reduced podocytes injury in diabetic nephropathy. SD male rats were intraperitoneally injected with 60 mg/kg streptozotocin. After 3 days, the rats with STZ treatment were garaged with 0.1μg/kg/d calcitriol or vehicle solution daily for consecutive 18 weeks. Kidney tissues were collected for histology. (A) Representative images of immunohistochemical staining for nephrin, podocin, desmin and WT1 (Wilms’ tumor 1) in renal cortex at 18th week (400×). (B) Immunoblot analysis of nephrin, podocin and desmin at 8th, 14th, 18th week in three groups. β-actin was used as the internal loading control. (C) Densitometry analysis of nephrin, podocin desmin and WT1. Data are expressed as means ± SD (n=6). Significance: *P<0.05 vs NC group, # P<0.05 vs DN group at the same time point, respectively.
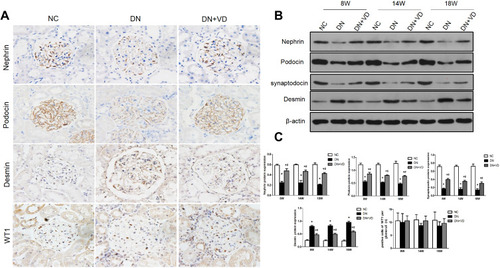
Figure 6 Calcitriol treatment restores autophagy activity in diabetic kidney diseases. SD male rats were intraperitoneally injected with 60 mg/kg streptozotocin. After 3 days, the rats with STZ treatment were garaged with 0.1 μg/kg/d calcitriol or vehicle solution daily for consecutive 18 weeks. Kidney tissues were collected for histology or immunoblot analysis at 18th week. (A) Co-staining of synaptopodin (green) and LC3B (red) proteins in glomeruli by double immunofluorescence staining (400×). (B) Immunohistochemical staining of Beclin-1 and P62 in the renal cortex (400×). (C) Immunoblot analysis of autophagy marker proteins LC3 II/I, Beclin-1 and P62 in renal cortex at 8th, 14th, 18th week in three groups, β-actin was used as a loading control. (D) Quantification of LC3 II/I, Beclin-1 and P62 protein. (E) Representative images showing autophagosomes (black arrow) in podocytes by electron microscopy. (F) Quantification of the autophagosomes (under 10,000/EMP from 8 randomly selected podocytes). Values are mean ± SD (n=6). Significance: *P<0.05 vs NC group, # P<0.05 VS DN group at the same time point group, respectively.
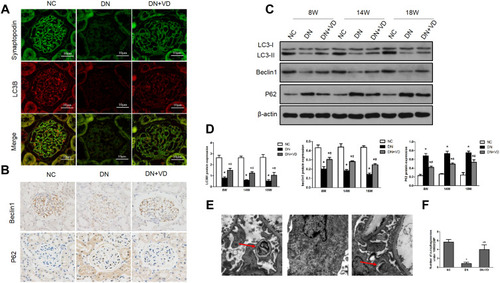
Figure 7 Calcitriol attenuates podocyte injury under high glucose. MPC5 were cultured for 24h in medium with 30 mM glucose or 5.5 mM glucose in the absence or presence of 100 nmol/L calcitriol. (A) Immunofluorescence staining of nephrin, podocin and desmin in medium containing NG, VD, HG and HG plus calcitriol for the indicated periods (400×). (B) Western blot was used to detect nephrin, podocin and desmin at different groups, cyclophilin B was used as an internal loading control. (C) The relative densities of the bands in each lane were analyzed and normalized to cyclophilin B in four group. Values are mean ± SD (n=3). Significance: *P<0.05 vs respective control group, # P<0.05 vs DN group at the same time point, respectively.
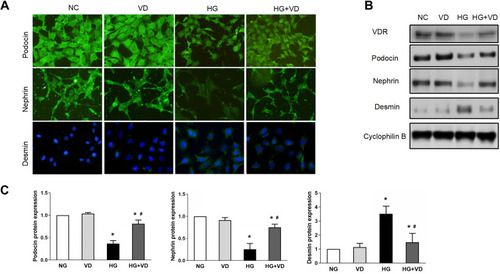
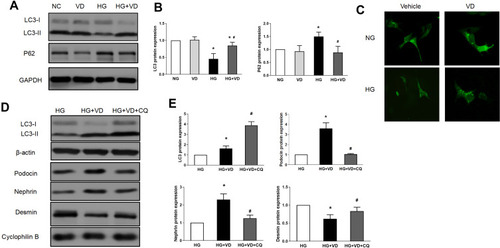
Figure 8 The protective effects of calcitriol against high-glucose induced injury are blocked by autophagy inhibitor chloroquine. MPC5 were cultured for 24 h in medium with 30 mM or 5.5 mM glucose in the absence or presence of 100 nmol/L calcitriol. Cells were collected for immunoblot analysis of LC3 and p62 (A and B) or fixed for immunofluorescent microphotographs of GFP-LC3-transfected podocytes (400×) (C). Podocytes were treated with 100 nmol/L calcitriol with and without 20 μM chloroquine (CQ) for 24 hours under high glucose condition. Whole cell lysate were collected for immunoblot analysis of LC3, nephrin, podocin and desmin (D and E). Values are mean ± SD (n=3). Significance: *P<0.05 vs respective control group, # P<0.05 vs DN group at the same time point, respectively.