
Figures & data
Table 1 Basic Data of the Control and VH Groups (t Test)
Table 2 Basic Data of the Three Subgroups of HBV, HCV, and HBV-HCV (ANOVA)
Figure 1 The glucose values (A) creatinine values (B) and eGFRcys (C) of the HBV, HCV, HBV-HCV subgroups and the control group showed significant differences; (D) average level of eGFRcys was different between the high eAG(GA) and low eAG(GA) groups of patients with viral hepatitis. (*P < 0.05, **P < 0.01, ***P < 0.001).
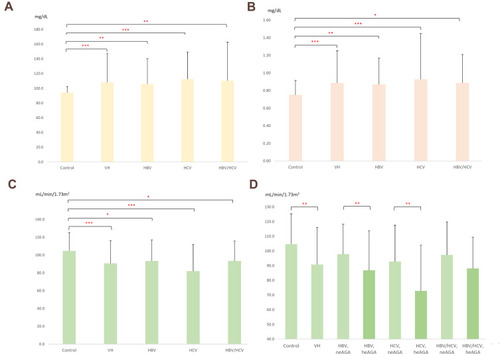
Table 3 The Compare of Prevalence Rates of eGFRcys <60 mL/Min/1.73m2 in the Control Group, VH Group, and Subgroups (Chi-Square Test)
Table 4 The Average Levels of eGFRcys, eAG(GA), Glucose, eAG(HbA1c), Cr, Cys C, and β2-Microglobulin in the High eAGe(GA) and Low eAG(GA) Groups of Patients with Viral Hepatitis (ANOVA)
Table 5 The Risk of Renal Impairment in the Control Group, VH Group, and Combine Hyperglycemia with VH Subgroups (Logistic Regression Models)