Figures & data
Figure 1 Relative expression of miR-140-5p in insulin-resistant HepG2 cells. The relative expression level of miR-14-5p in HepG2 cells and insulin-resistant HepG2 cells was detected by qRT-qPCR (n=8). Data were the presented as the mean ± standard deviation; ** P<0.01, compared with the normal group.
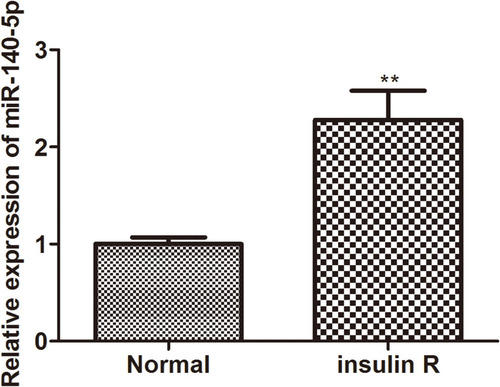
Figure 2 Effect of miR-140-5p on glucose metabolism in insulin-resistant HepG2 cells. (A and B) Glucose consumption and glucose uptake in insulin-resistant HepG2 cells transfected with miR-140-5p inhibitor (n=8). (C and D) Glucose consumption and glucose uptake in HepG2 cells transfected with miR-140-5p mimic (n=8). Data were expressed as the mean ± standard deviation; ** P<0.01 compared with the NC inhibitor/mimic group.
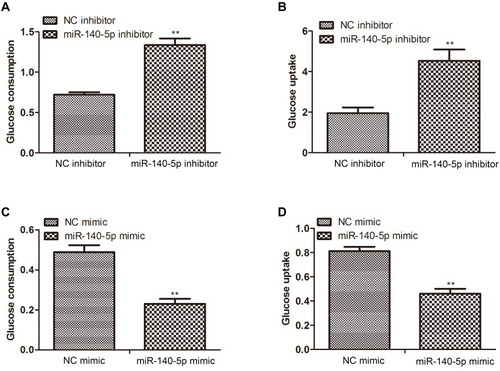
Figure 3 miR-140-5p negatively regulated GYS1 and PPP1CC expression. (A) Bioinformatics analysis of predicted interaction of miR-140-5p with its binding sites in the GYS1 and PPP1CC gene. (B) Relative luciferase activity in HepG2 cells co-transfected with either NC mimic or miR-140-5p mimic and GYS1-Wt/PPP1C-Wt or GYS1-Mut/PPP1C-Mut (n=8). (C) qRT-PCR showing relative expression of GYS1 and PPP1CC in HepG2 cells transfected with NC mimic, miR-140-5p mimic (n=8). (D) Western blotting showing relative protein expression of GYS1 and PPP1CC in HepG2 cells transfected with NC mimic, miR-140-5p mimic. β-actin was detected as a loading control (n=8). (E) qRT-PCR showing relative expression of GYS1 and PPP1CC in insulin-resistant HepG2 cells (n=8). Data were expressed as the mean ± standard deviation; ** P<0.01, ***P<0.001, compared with the normal group.
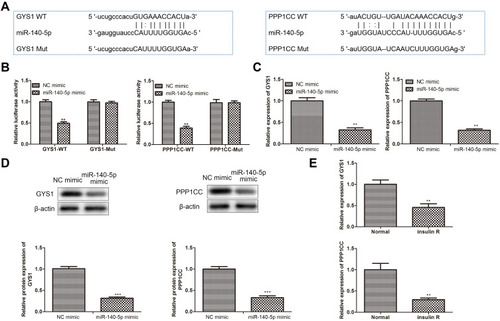
Figure 4 Effect of miR-140-5P on the downstream substrates of target genes. (A and B) Glycogen content in HepG2 cells transfected with NC inhibitor, miR-140-5p inhibitor, NC mimic, miR-140-5p mimic (n=8). Data were expressed as the mean ± standard deviation; ** P<0.01 compared with the NC inhibitor/mimic group.
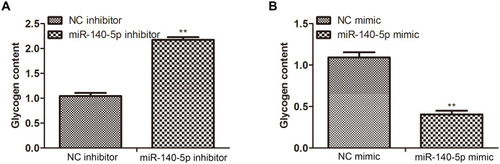
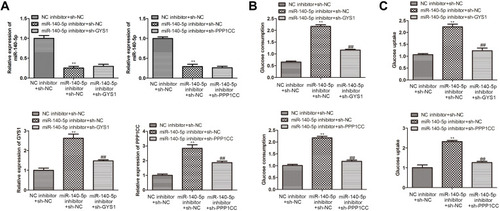
Figure 5 Knockdown of miR-140-5p improved cellular glucose metabolism via targeting GYS1 and PPP1CC gene. (A) qRT-PCR showing the relative expression level of miR-14-5p, GYS1 and PPP1CC in insulin-resistant HepG2 cells transfected with NC inhibitor + sh-NC, miR-140-5p inhibitor + sh-NC, miR-140-5p inhibitor + sh-GYS1/sh-PPP1CC (n=8). (B( and (C) Glucose consumption and glucose uptake in insulin-resistant HepG2 cells transfected with NC inhibitor + sh-NC, miR-140-5p inhibitor + sh-NC, miR-140-5p inhibitor + sh-GYS1/sh-PPP1CC (n=8). Data were expressed as the mean ± standard deviation; ** P<0.01 compared with the NC inhibitor + sh-NC group; ##P<0.01 compared with the miR-140-5p inhibitor + sh-NC.