Figures & data
Table 1 Comparison of Patients’ Characteristics Among Different Obesity Patterns (n = 5860)
Figure 1 Comparison of the T2DM incidence among different obesity patterns (n = 5860).
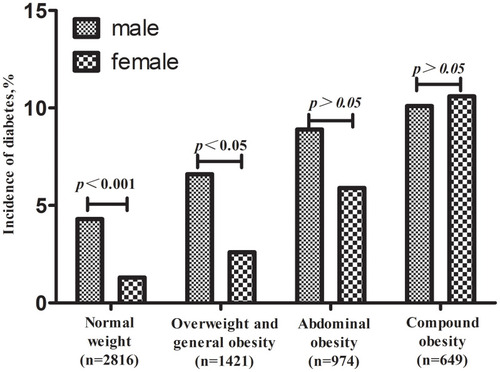
Table 2 Multivariate Logistic Regression Model of Associations Between Different Patterns of Obesity and T2DM Risk (n = 5860)
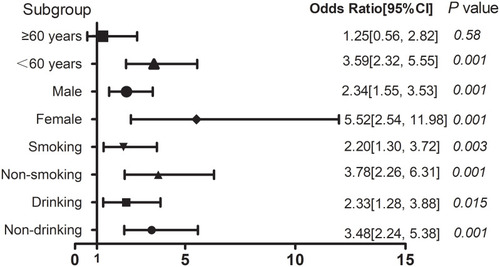
Figure 2 Subgroup analyses for the risks of developing T2DM in the overweight and general obesity group compared with the normal-weight group.
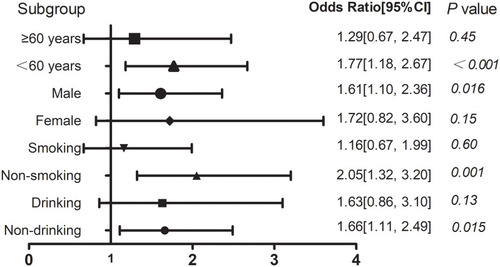
Figure 3 Subgroup analyses for the risks of developing T2DM in the group with abdominal obesity compared with the normal-weight group.
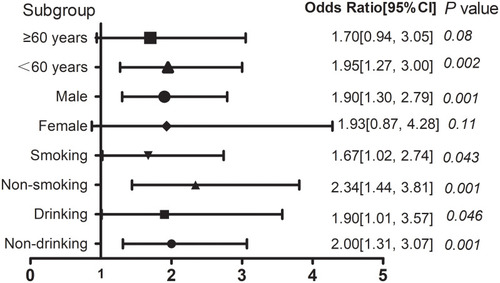
Figure 4 Subgroup analyses for the risks of developing T2DM in the group with compound obesity compared with the normal-weight group.