
Figures & data
Table 1 Clinical Characteristics of All Participants
Table 2 Clinical Characteristics of All Patients with T2DM with and without Vitamin D Deficiency
Figure 1 Comparisons of HGI in No vitamin D deficiency group and Vitamin D deficiency group.(A) Comparisons of HGI in No vitamin D deficiency group and Vitamin D deficiency group in all participants. (B) Comparisons of HGI No vitamin deficiency group and Vitamin D deficiency group in female participants. (C) Comparisons of HGI in No vitamin deficiency group and Vitamin D deficiency group in male participants. *Denotes significance at a P value of <0.05.
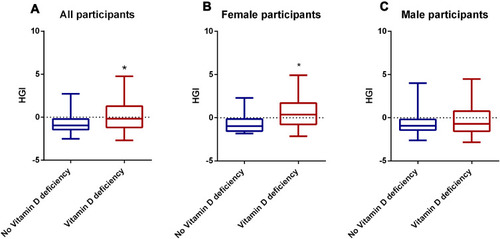
Table 3 Clinical Characteristics of All Patients with T2DM in the High and Low HGI Groups
Figure 2 Comparisons of 25(OH)D levels and prevalence of vitamin D deficiency in the High HGI group and Low HGI group for all participants (A). Comparisons of 25(OH)D levels in the High HGI group and Low HGI group for all participants. (B) Comparisons of the prevalence of vitamin D deficiency in the High HGI group and Low HGI group for all participants. *Denotes significance at a P value of <0.05.
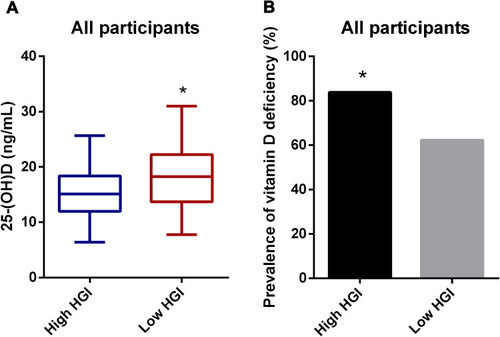
Table 4 Clinical Characteristics of Male and Female Patients with T2DM
Table 5 Clinical Characteristics of Male and Female Patients with T2DM with and without Vitamin D Deficiency
Figure 3 Comparisons of HGI levels and 25(OH)D levels in female group and male group for all participants. (A) Comparisons of HGI levels in female group and male group for all participants. (B) Comparisons of the 25(OH)D levels in female group and male group for all participants. *Denotes significance at a P value of <0.05.
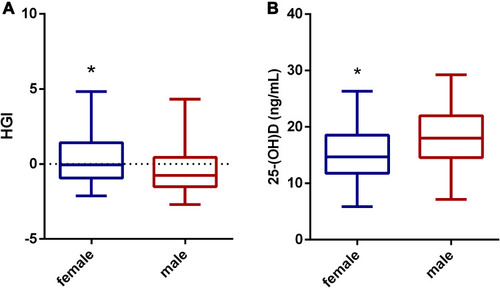
Table 6 Correlation Between Vitamin D and Other Factors in Patients with T2DM
Figure 4 The correlation between vitamin D and HGI levels. (A) The correlation between vitamin D and HGI levels in all participants. (B) The correlation between vitamin D and HGI levels in female participants. (C) The correlation between vitamin D and HGI levels in male participants.
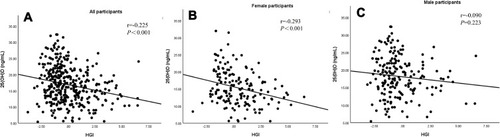
Table 7 Correlation Between Vitamin D and HGI in All Patients with T2DM
Table 8 Correlation Between Vitamin D and HGI in Female Patients with T2DM
Table 9 Correlation Between Vitamin D and HGI in Male Patients with T2DM