Figures & data
Table 1 Scanning Parameters of Structural T1-Weighted Images and BOLD Sequence
Figure 1 The center of V1 was chosen as the seed point to calculate FC (the red area).
Abbreviations: FC, functional connectivity; L, left; R, right; V1, primary visual cortex.
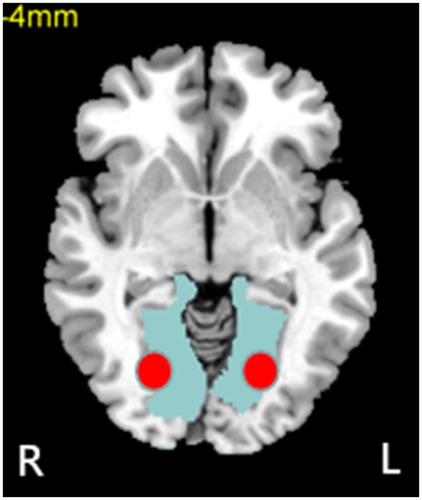
Table 2 Demographics and Visual Measurements Among Three Groups
Figure 2 The fundus photos with the typical presentations of DR.
Abbreviations: DR, diabetic retinopathy; OD, oculus dexter; OS, oculus sinister.
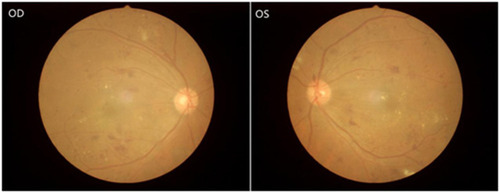
Table 3 Significant Differences in the FC of Left V1 Among Three Groups
Table 4 Significant Differences in the FC of Right V1 Among Three Groups
Figure 3 Distribution group mean zFC among DR, DM and HC group.
Notes: (A) Distribution mean zFC pattern of left V1 in group-level of DR, DM and HC group in the typical frequency band (0.01–0.08 Hz). (B) Distribution mean zFC pattern of right V1 in group-level of DR, DM and HC group in the typical frequency band (0.01–0.08 Hz) (p<0.01).
Abbreviations: FC, functional connectivity; DR, diabetic retinopathy; DM, diabetes mellitus; HC, healthy control; L, left; R, right; V1, primary visual cortex.
Abbreviations: FC, functional connectivity; DR, diabetic retinopathy; DM, diabetes mellitus; HC, healthy control; L, left; R, right; V1, primary visual cortex.
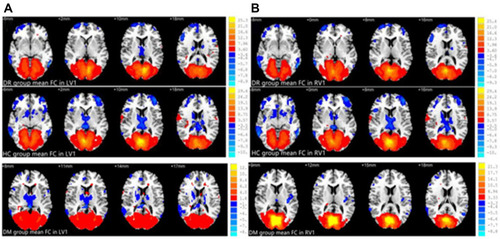
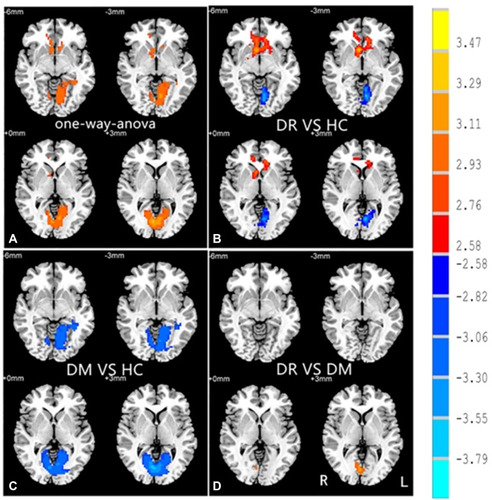
Figure 4 Significant zFC maps of left V1 differences among three groups.
Notes: ROI in the left V1. (A) Significant zFC maps of left V1 differences among three groups using one-way ANOVA. (B) Significant zFC maps of left V1 differences between DR and HC groups; (C) Significant zFC maps of left V1 differences between DM and HC groups; (D) Significant zFC maps of left V1 differences between DR and DM groups (voxel-level: p<0.01, GRF correction, cluster-level: p<0.05).
Abbreviations: ROI, region of interest; V1, primary visual cortex; DR, diabetic retinopathy; DM, diabetes mellitus; HC, healthy control; FC, functional connectivity; L, left; R, right; GRF, Gaussian random field.
Abbreviations: ROI, region of interest; V1, primary visual cortex; DR, diabetic retinopathy; DM, diabetes mellitus; HC, healthy control; FC, functional connectivity; L, left; R, right; GRF, Gaussian random field.
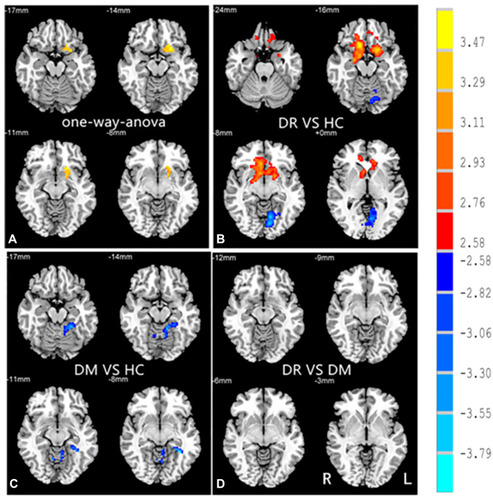
Figure 5 Significant zFC maps of right V1 differences among three groups.
Notes: ROI in the right V1. (A) Significant zFC maps of right V1 differences among three groups using one-way ANOVA. (B) Significant zFC maps of right V1 differences between DR and HC groups; (C) Significant zFC maps of right V1 differences between DM and HC groups; (D) Significant zFC maps of right V1 differences between DR and DM groups (voxel-level: p<0.01, GRF correction, cluster-level: p<0.05).
Abbreviations: ROI, region of interest; V1, primary visual cortex; DR, diabetic retinopathy; DM, diabetes mellitus; HC, healthy control; FC, functional connectivity; L, left; R, right; GRF, Gaussian random field.
Abbreviations: ROI, region of interest; V1, primary visual cortex; DR, diabetic retinopathy; DM, diabetes mellitus; HC, healthy control; FC, functional connectivity; L, left; R, right; GRF, Gaussian random field.