Figures & data
Table 1 Characteristics of Participants According to Quintile of Akkermansia Abundance (n=6896)
Figure 1 Associations between the relative abundance of Akkermansia and MetS and its components. (A and B) ORs and 95% CIs for MetS and its components with a 1% increase in the abundance of Akkermansia (A), and across quintiles of Akkermansia (with Q1 as a reference) (B). (C) Relative abundance of Akkermansia in participants with different numbers of MetS components. (D) Linear association between Akkermansia and the number of MetS components; dashed lines represent the 95% CI. Trend test of ORs across quintiles (Q1–Q5) was conducted by entering the median value of each quintile of Akkermansia abundance into the models. *P for trend <0.05; **P for trend <0.01; ***P for trend ≤ 0.001.
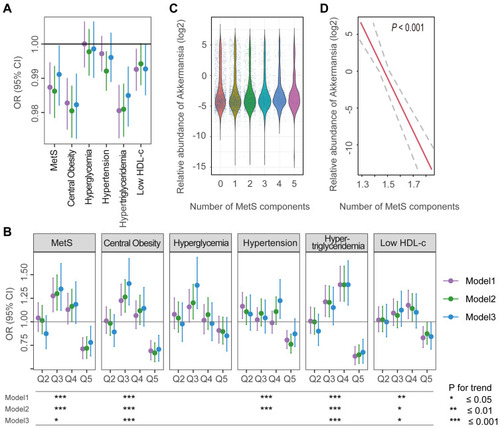
Figure 2 Dose–response effect of Akkermansia on MetS and its components. (A) Association between risk of MetS and relative abundance of Akkermansia. Dose–response curves of Akkermansia were fitted to logistic models with cubic splines. Four knots at the 5th, 25th, 75th, and 95th percentiles were used in models. Model 1 was a crude regression without adjusting for confounders; model 2 was adjusted for age and sex; and model 3 was further adjusted for Bristol stool scale, geographic location, and annual income. A trend test of ORs across quintiles (Q1–Q5) was conducted by entering the median value of each quintile of Akkermansia abundance into the models. (B) ORs and 95% CIs across 20 percentiles of Akkermansia (with the first quintile [Q1] as a reference) in crude logistic models.
![Figure 2 Dose–response effect of Akkermansia on MetS and its components. (A) Association between risk of MetS and relative abundance of Akkermansia. Dose–response curves of Akkermansia were fitted to logistic models with cubic splines. Four knots at the 5th, 25th, 75th, and 95th percentiles were used in models. Model 1 was a crude regression without adjusting for confounders; model 2 was adjusted for age and sex; and model 3 was further adjusted for Bristol stool scale, geographic location, and annual income. A trend test of ORs across quintiles (Q1–Q5) was conducted by entering the median value of each quintile of Akkermansia abundance into the models. (B) ORs and 95% CIs across 20 percentiles of Akkermansia (with the first quintile [Q1] as a reference) in crude logistic models.](/cms/asset/3f68fe23-7dd0-4ec8-82d2-df2cbb728d68/dmso_a_12185118_f0002_c.jpg)
Table 2 Risks of MetS and Its Components in Subjects with Higher Akkermansia Compared to Those with Lower Akkermansia (or, 95% CI)a
Figure 3 Distribution of Akkermansia OTUs and their correlations with other microbiota. (A) Distribution of 3 Akkermansia OTUs. (B) Overlap of the distributions of Akkermansia OTUs in all participants. (C) Correlations of the 3 Akkermansia OTUs. r is the Pearson coefficient. (D) Associations between Akkermansia OTUs and other gut microbes. The first and second circles represent OTUs at the genus (g) and family (f) levels, respectively; and red and green lines represent positive and negative correlations, respectively. Only significant correlations are shown.
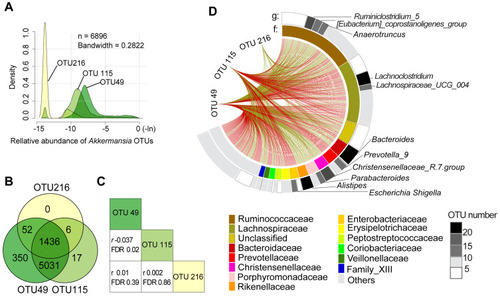
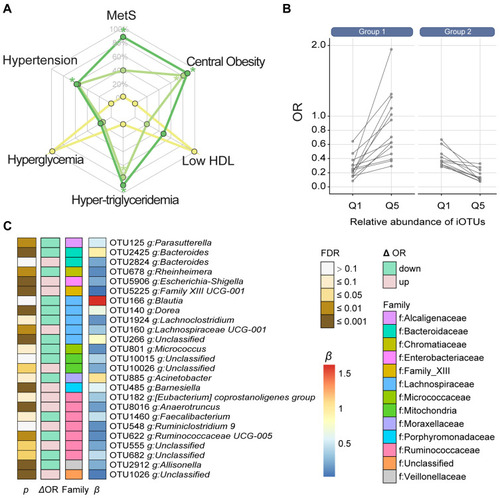
Figure 4 Effects of microbial interactions on the Akkermansia–MetS association. (A) Associations of MetS and its components with 3 Akkermansia OTUs. (B) Groups of iOTUs according to their effects on the Akkermansia–MetS association. Interactions were visualized by changes in the protective effect of Akkermansia against MetS (ORs) when the abundance of iOTUs increased from Q1 to Q5. ORs were estimated by logistic regression in which the abundance of Akkermansia was treated as a continuous variable. (C) Annotation of iOTUs at the family and genus levels. β and FDR were estimated with the multivariate linear regression. Equation: .