
Figures & data
Figure 1 A schematic overview above in- and outpatient stays of the vocational rehabilitation program.
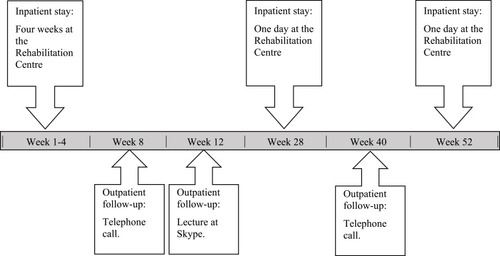
Table 1 Characteristics of the Participants at Baseline
Table 2 Comparison of WAS, DWP, HRQoL, BMI, and RTWSE from Baseline to 12-Month Follow-Up
Table 3 Associations Between Changes in the 12-Month Follow-Up Period in HRQoL, BMI, and RTWSE with WAS in Combination with Work Absence and RTWEXP, Adjusted for the Background Variables. Unadjusted and Adjusted Multiple Regression Analyses
Table 4 Associations Between Changes in the 12-Month Follow-Up Period in HRQoL, BMI, WAS, and RTWSE with DWP in Combination with DWP Baseline and RTWEXP, Adjusted for the Background Variables. Unadjusted and Adjusted Multiple Regression Analyses