
Figures & data
Figure 1 Research flow chart.
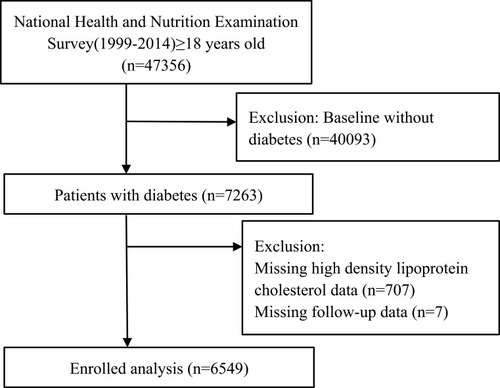
Table 1 Baseline Characteristics According to High-Density Lipoprotein Cholesterol Levels
Figure 2 Kaplan-Meier survival curves for all-cause (A), cardiovascular (B), and cancer (C) mortality by high density lipoprotein cholesterol groups.
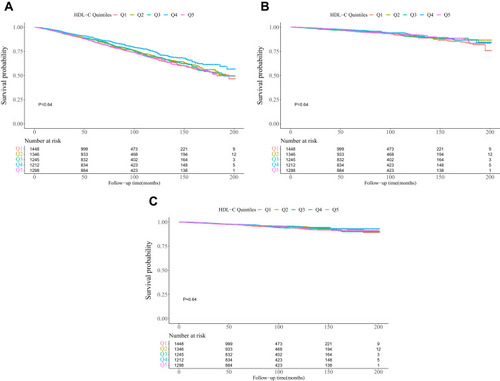
Table 2 Multivariate Cox Regression Analysis of HDL-C Levels with Cause-Specific Mortality
Table 3 The Results of Two-Piecewise Linear Regression Model Between High-Density Lipoprotein Cholesterol and Cause-Specific Mortality
Figure 3 Adjusted spline curves analyze for the association of high density lipoprotein cholesterol with all-cause (A), cardiovascular (B), and cancer (C) mortality. Age, gender, body mass index, race, education level, smoking, systolic blood pressure, estimated glomerular filtration rate, glycohemoglobin, total cholesterol, comorbidities (hypertension, cardiovascular disease, and cancer), and medicine use (antihypertensive drugs, hypoglycemic agents, lipid-lowering drugs, and antiplatelet drugs) were adjusted.
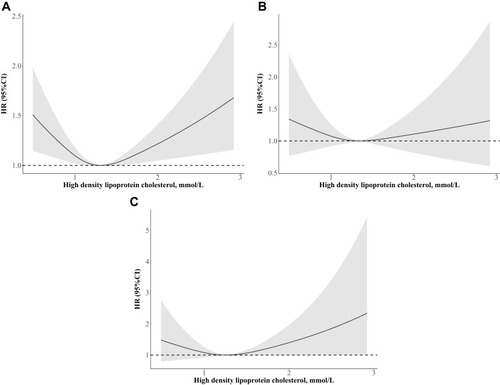
Table 4 Subgroups Analysis