Figures & data
Table 1 Demographical and Clinical Characteristics of the Study Population with and without Macrovascular Complications
Table 2 Prevalence Ratio of Macrovascular Complications Based on Multivariate Logistic Regression on Thyroid Hormone Levels
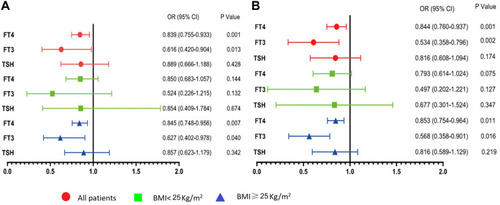
Figure 1 Prevalence ratio of macrovascular complications based on multivariate logistic regression on thyroid hormone levels. ((A) Adjusted for age and sex. (B) Adjusted for age, sex, duration of T2DM, SBP, DBP, BMI, HbA1c, TG, TC, HDL-C, LDL-C, and VLDL-C.).
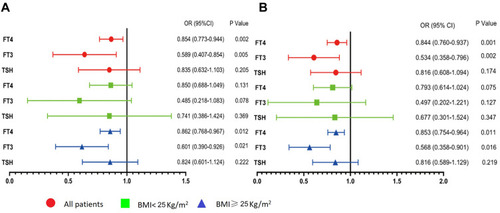
Table 3 Prevalence Ratio of Macrovascular Complications Based on Multivariate Logistic Regression on Thyroid Hormone Levels Within Patients with Abnormal HbA1cHbA1c
Figure 2 Prevalence ratio of macrovascular complications based on multivariate logistic regression on thyroid hormone levels within patients with abnormal HbA1c. ((A) Adjusted for age and sex. (B) Adjusted for age, sex, duration of T2DM, SBP, DBP, BMI, HbA1c, TG, TC, HDL-C, LDL-C, and VLDL-C.).