Figures & data
Figure 1 The analysis flow chart of this study.
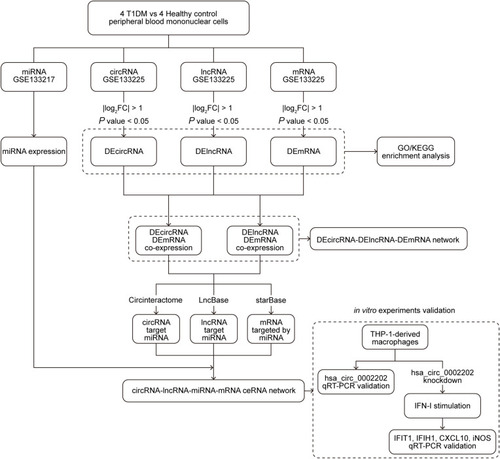
Table 1 Primers Used for qRT-PCR
Table 2 Differentially Expressed circRNAs Between the Control Group and T1DM Group
Table 3 Results of Gene Ontology (GO) Enrichment Analysis of Differentially Expressed circRNAs
Table 4 Results of KEGG Enrichment Analysis of Differentially Expressed circRNAs
Figure 2 The differentially expressed circRNAs in T1DM and healthy patients. (A) Volcano plot of DEcircRNAs between normal and T1DM groups. Red and green indicate up- and downregulation, respectively. (B) Heatmap of DEcircRNAs between normal and T1DM groups. Red color represents increased expression, and green color represents decreased expression. The darker the color, the greater the difference of circRNA expression. (C) Enrichment analysis of the DEcircRNAs in the categories biological process, cellular component, and molecular function.
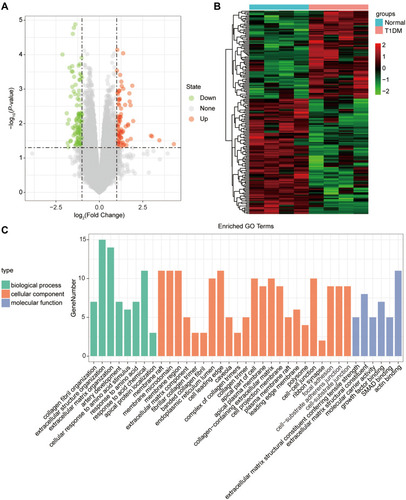
Table 5 Differentially Expressed lncRNAs Between the Control Group and T1DM Group
Table 6 Results of Gene Ontology (GO) Enrichment Analysis of Differentially Expressed lncRNAs
Figure 3 The differentially expressed lncRNAs in T1DM and healthy patients. (A) Volcano plot of DElncRNAs between normal and T1DM groups. Red and green indicate up- and downregulation, respectively. (B) Heatmap of DElncRNAs between normal and T1DM groups. Red color represents increased expression, and green color represents decreased expression. The darker the color, the greater the difference of lncRNA expression. (C) Enrichment analysis of the DElncRNAs in the categories biological process and cellular component.
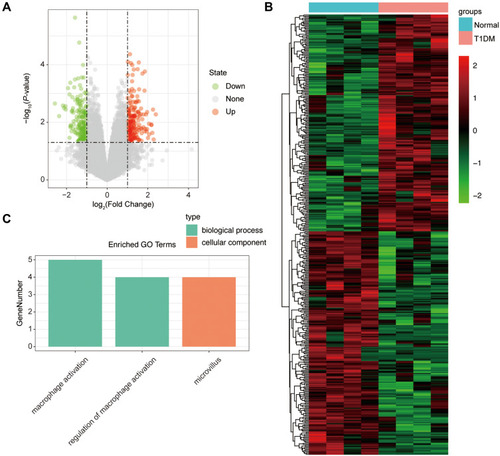
Table 7 Differentially Expressed mRNAs Between the Control Group and T1DM Group
Table 8 Results of Gene Ontology (GO) Enrichment Analysis of Differentially Expressed mRNAs
Figure 4 The differentially expressed mRNAs in T1DM and healthy patients. (A) Volcano plot of DEmRNAs between normal and T1DM groups. Red and green indicate up- and downregulation, respectively. (B) Heatmap of DEmRNAs between normal and T1DM groups. Red color represents increased expression, and green color represents decreased expression. The darker the color, the greater the difference in mRNA expression. (C) Enrichment analysis of the DEmRNAs in the category molecular function.
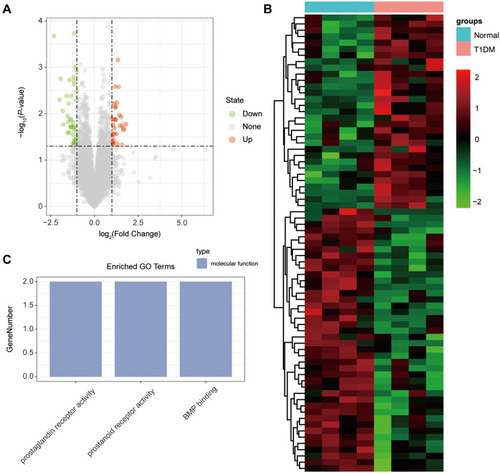
Table 9 The Fold Change of All miRNAs Between the Control Group and T1DM Group
Figure 5 The circRNA-lncRNA-mRNA network. The round nodes represent DEcircRNAs, the rhombic nodes represent DElncRNAs, the v-type nodes represent DEmRNAs. The up or down-regulated genes are represented in red and green, respectively.
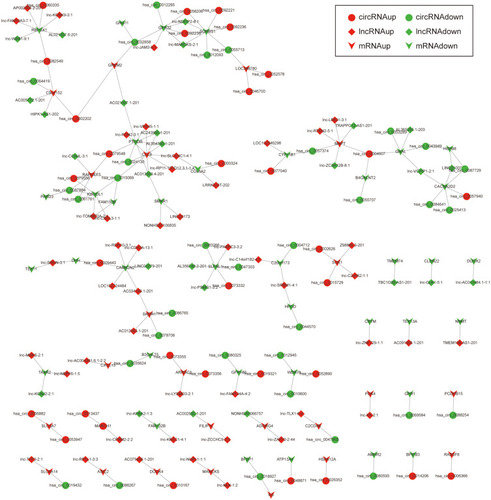
Figure 6 The circRNA-lncRNA-miRNA-mRNA network. The round nodes represent DEcircRNAs, the rhombic nodes represent DElncRNAs, the v-type nodes represent DEmRNAs, the square nodes represent DEmiRNAs. The up or down-regulated genes are represented in red and green, respectively.
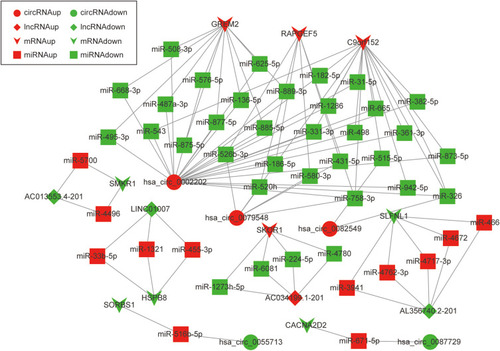
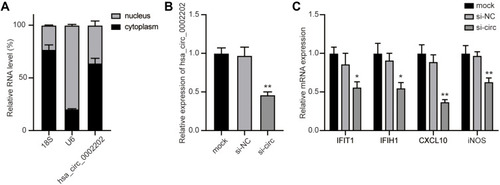
Figure 7 Inhibition of hsa_circ_0002202 suppressed IFN-I-induced inflammation. (A) Subcellular distribution of hsa_circ_0002202 in the nucleus and cytoplasm in THP-1-derived macrophages. (B) qRT-PCR detection of hsa_circ_0002202 expression after transfection with si-NC or si-circ. (C) qRT-PCR detection of IFIT1, IFIH1, CXCL10, and iNOS expression under IFN-I stimulation after treatment with hsa_circ_0002202 siRNA. Data are presented as the mean ± SD of three experiments and analyzed using one-way ANOVA with Tukey’s post-test. *P<0.05, **P<0.01, compared with the si-NC group.