Figures & data
Figure 1 Flow-chart of study design.
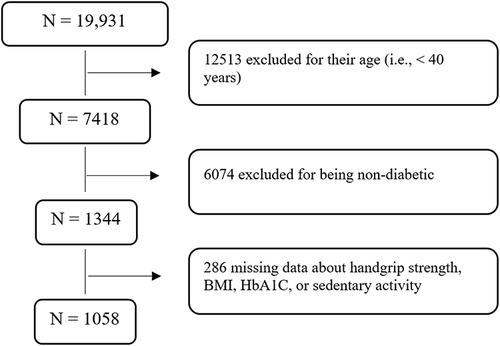
Table 1 Sample Characteristics by Quartiles of Protein Intake (N = 990)
Table 2 Odds Ratio (95% CI) for Poor Glycemic Control by Quartiles of Protein Intake
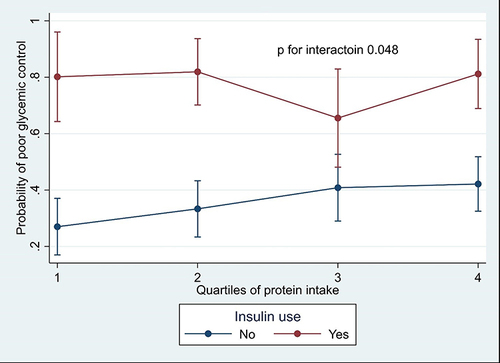
Figure 2 Interaction between insulin use and protein intake in relation to poor glycemic control.
Notes: Model adjusted for age, gender, race, energy intake, muscle strength, sedentary activity, income-to-poverty ratio, education, smoking, alcohol drinking, BMI, other medications for diabetes, and duration of diabetes.