Figures & data
Figure 1 Effect of Thymoquinone on serum level of T3 (A), T4 (B), TSH (C), fasting insulin (D) and glucose (E), HOMA-IR and HOMA-β (F). *Significantly different compared to the control group (p<0.05). #Significantly different compared to the Hypothyroid group (p<0.05).

Figure 2 Effect of Thymoquinone on serum level of MDA (A), NO (B) and antioxidant activities of catalase (CAT) (C), Glutathione peroxidase (GPX) (D), reduced glutathione (GSH) (E) and superoxide dismutase (SOD) (F). *Significantly different compared to the control group (p<0.05). #Significantly different compared to the Hypothyroid group (p<0.05).
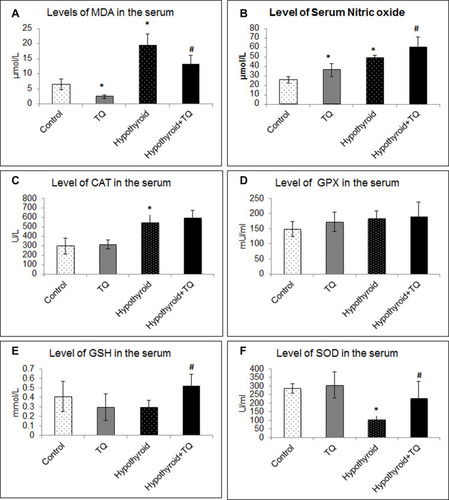
Figure 3 Effect of Thymoquinone on gene expression of catalase (A), β-catenin (B) and IL-10 (C) in pancreatic islets of Langerhans. *Significantly different compared to the control group (p<0.05). #Significantly different compared to the hypothyroid group (p<0.05).
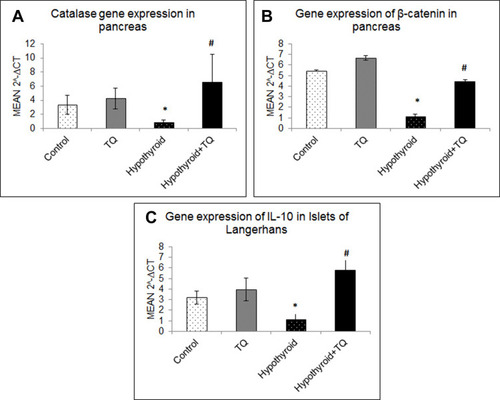
Figure 4 Effect of Thymoquinone on histological structure of the pancreatic islets of Langerhans (A–D) as well as immunoexpression of insulin (E–H), caspase-3 (I–L) and β-catenin (M–P) expression in the pancreas of the studied groups. Haematoxylin and eosin-stained section showed islets (IS) between the pancreatic acini (AC). Islet cells (arrow) appear intact in control, TQ and hypothyroid+TQ groups while they appear degenerated in Hypothyroid group. Note the presence of blood capillaries (thick arrow). Qualitative assessment of the morphometric measurements and immunoexpression (Q–T) was done using image Pro Plus image analysis software version 6.0. *Significantly different compared to the control group (p<0.05). #Significantly different compared to the Hypothyroid group (p<0.05).
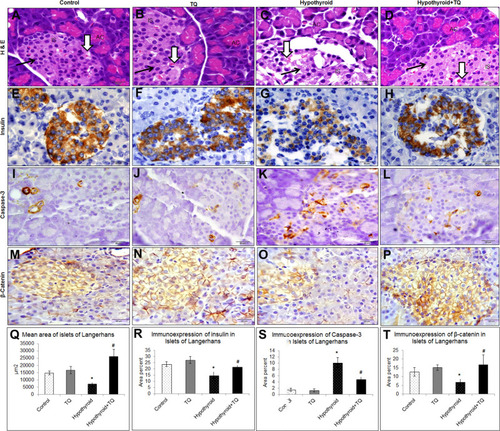
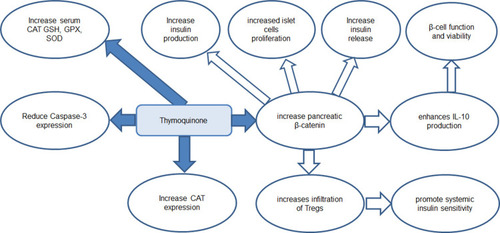
Figure 5 A diagram summarized the proposed mechanism of antihyperglycemic effect of thymoquinone in hypothyroid model. Catalase (CAT) (C), glutathione peroxidase (GPX) (D), reduced glutathione (GSH) (E) and superoxide dismutase (SOD), T regulatory cells (Tregs).