
Figures & data
Table 1 Characteristics of the Participants by Weight Status
Figure 1 The percentage of overweight and obesity (by age group) for boys and girls. a P<0.05 compared with boys; b P<0.05 compared with children aged 6–8 years; c P<0.05 compared with children aged 9–11 years; d P<0.05 compared with children aged 12–14 years; e P<0.05 compared with children aged 15–18 years.
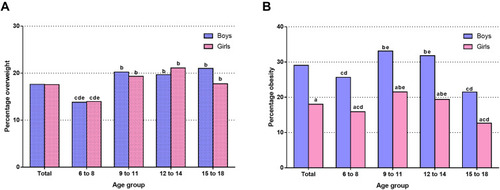
Figure 2 Logistic regression analysis of risk factors for overweight/obesity. Multivariate odds ratios (OR) and 95% confidence interval (CI) from bivariate regression models were used in the analysis. Variables including age, sex, father obesity, father’s education, mother obesity, mother’s education, mother’s glucose level during pregnancy, infant breastfeeding, birth weight ≥4 kg, household income (ten thousand yuan/year), siblings, frequency of breakfast, having breakfast at home, having dinner with parents, frequency of restaurant, watching TV, frequency of exercise, exercise time and sleep duration were entered in the model.
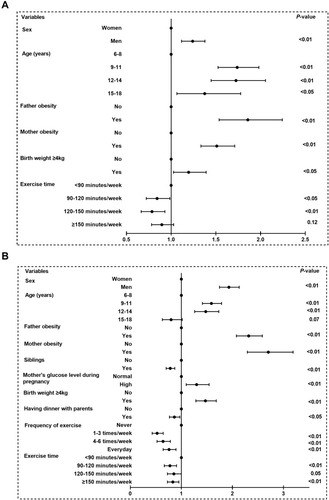
Figure 3 Distribution and percentages of exercise time by weight groups in children aged 9–11 years. * means P<0.05.
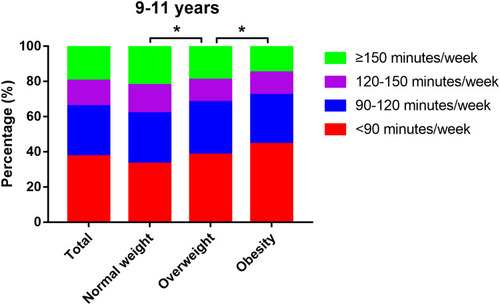
Figure 4 Distribution and percentages of exercise time by age and weight groups.
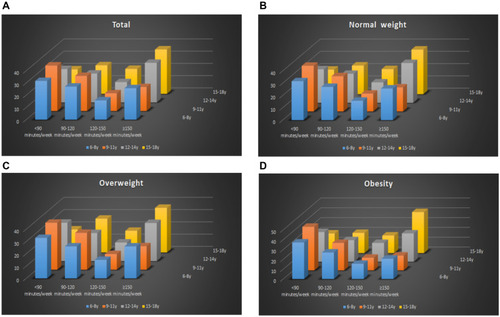
Table 2 Unconditional Logistic Regression Analysis of Exercise Time According to the Age Group