
Figures & data
Table 1 The Clinical Data of the Baseline Data of 216 Participants
Figure 1 Comparison of SOX2OT expression between GDM and non-GDM groups on the day of admission and the day of diagnosis. Plasma samples from all participants on the day of admission and the day of the diagnosis of GDM were subjected to RNA isolation and RT-qPCRs to determine SOX2OT expression. Expression SOX2OT levels in GDM and non-GDM groups on the day of admission (A) and the day of diagnosis (B) were compared using the unpaired t-test. SOX2OT expression in GDM (C) or non-GDM (D) group at two different time points was compared using paired t-test. Each qPCR was repeated three times, and the average values were presented. *p<0.05; **p<0.01.
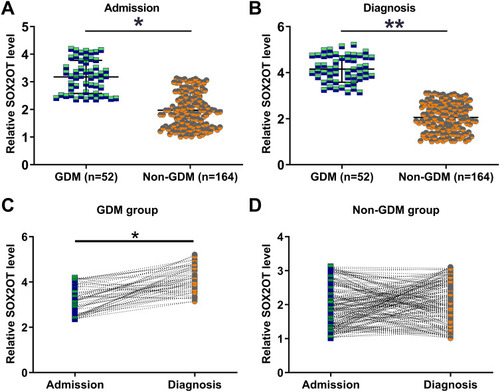
Figure 2 SOX2OT expression on the day of admission was sufficient to separate GDM patients from non-GDM participants. The diagnostic value of plasma SOX2OT on the day of admission for GDM was analyzed with ROC curve analysis, which was performed with GDM patients as the true positive cases and non-GDM participants as the true negative cases. The area under the curve (AUC) was calculated automatically.
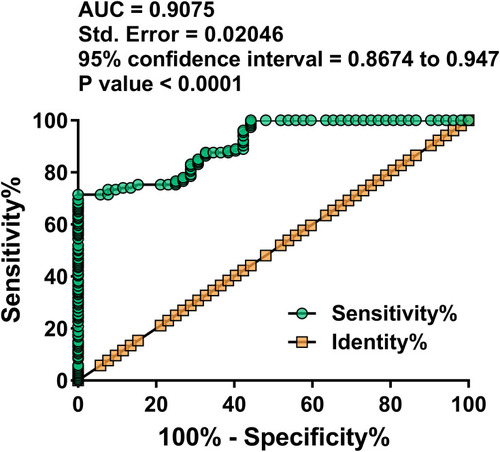
Figure 3 Analysis of the prognostic value of SOX2OT expression on the day of admission for GDM. The 216 participants were divided into high and low SOX2OT level groups (n=108), with the median SOX2OT level on the day of admission as the cutoff value. The high SOX2OT level group included 40 GDM patients, and the low SOX2OT level group included 12 GDM patients. GDM-free curves were plotted for both groups based on the follow-up data. GDM-free curves were compared by Log rank test.
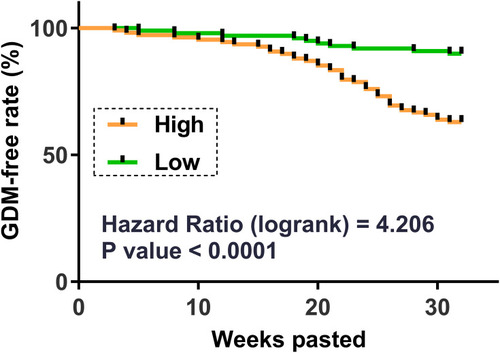
Table 2 Chi-Squared Test or Fisher Exact Test Analysis of the Associations of SOX2OT Expression on the Day of Admission and Adverse Events