Figures & data
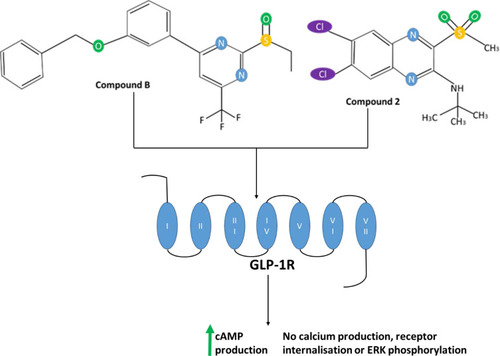
Figure 1 Variation in the percentage of obese and overweight individuals over 18 years of age in the population between different countries in 2016.Citation325 Values displayed are an average of the male and female percentage of the population for each country, which were taken from the WHO data.Citation325
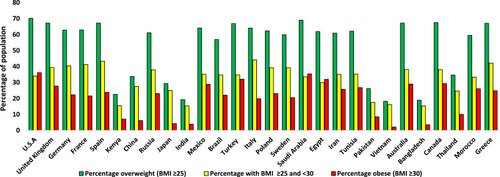
Figure 2 (A) The varying estimated prevalence of T2D in 2013 and projections for 2035, between ages 20–79 years.Citation1 (B) The varying estimated prevalence of T2D in 2019 and projections for 2030 and 2045, between ages 20–79 years.Citation62 The numbers above are the values for each country, indicating the percentage increase of diabetes patients from 2013 to 2035 (A) or from 2019 to 2045 (B) for any given country, rounded to the nearest whole number. Data from these studies.Citation1,Citation62
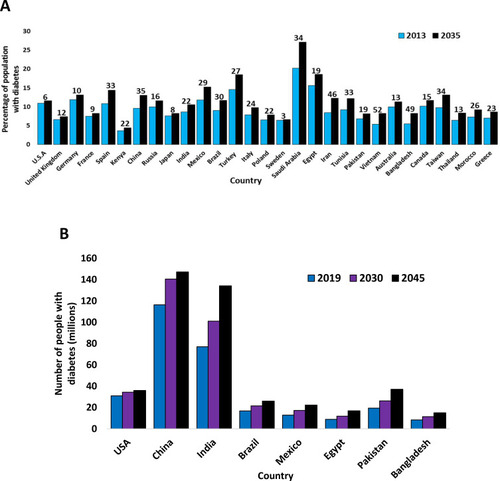
Table 1 Variation of T2D Prevalence Between Global Regions in 2013 and Projections for 2035
Table 2 Variation of T2D Prevalence Between Global Regions in 2019 and Projections for 2030 and 2045
Figure 3 Comparing healthy and type 2 diabetic phenotypes. In healthy individuals, insulin is produced and secreted by beta-cells in the islets of Langerhans (found in the pancreas) when blood glucose levels are above 5mM. Beta-cells are the most abundant cell type in the islets (~70%) and alpha-cells (responsible for glucagon secretion) are the second most abundant (~20%). Insulin then binds to the insulin receptor (IR), which allows uptake of glucose into tissues by inducing translocation of GLUT4 receptors from intracellular vesicles to the plasma membrane. GLUT4 is primarily found in adipose tissue as well as skeletal and cardiac muscle. Glucose is then transported into the cell by GLUT4 from the bloodstream and catabolised in the cell for ATP production, which provides the fuel for intracellular processes, or glucose can be converted to either glycogen or fat for fuel storage after uptake. In individuals with T2D, many islet beta-cells have undergone apoptosis and the function of the surviving cells is impaired, which results in markedly reduced insulin levels in circulation. Additionally, peripheral tissue insulin resistance impairs the action of insulin, resulting in reduced uptake of glucose from circulation, as a result of decreased GLUT4 translocation to the membrane. Reduced insulin levels and action result in hyperglycaemia and hyperlipidaemia, and subsequent T2D associated symptoms manifest in the patient. Inappropriate glucagon secretion, diminished incretin hormone action, increased proinsulin secretion, impaired pancreatic islet neural regulation, and islet amyloid deposition are also characteristic of T2D. This figure and information in its legend are with data adapted from these studies.Citation105,Citation106,Citation111,Citation326–Citation328
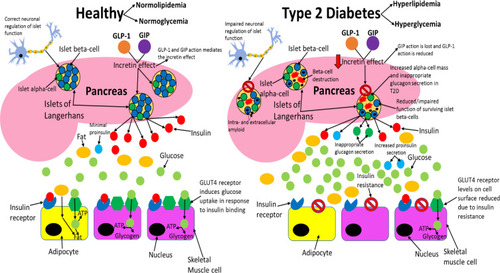
Figure 4 The difference between pancreatic islet architecture in healthy individuals and individuals with T2D. In healthy individuals, beta-cells are situated centrally and peripherally and are the most abundant cell type (~70%). Non-beta cells are found in the periphery of the islets and constitute ~30% of the cell population (20% alpha-cell and 10% other cell types). Islet architecture is altered in T2D with a greatly diminished population of beta-cells, more alpha-cells, more delta-cells, migration of alpha- and delta-cells into the centre, extracellular amyloid plaque deposits, intracellular IAPP oligomers in beta-cells, and enlarged alpha-cells. The altered architecture in T2D produces different intra-islet paracrine signalling which impairs metabolic homeostasis. This figure and information in its legend are with data adapted from Brereton et al.Citation141
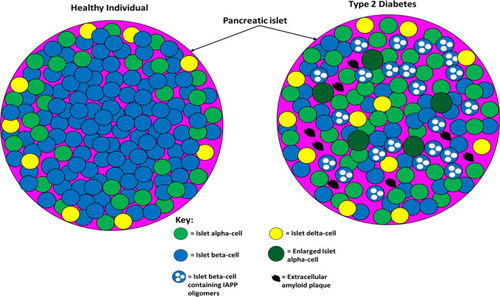
Figure 5 Comparing the differential neural regulation of pancreatic islets in healthy and type 2 diabetic individuals. T2D patients do not exhibit the cephalic phase of insulin secretion and based on the findings from studies it is possible that dysfunctional neuronal regulation of pancreatic islets contributes to the impaired GSIS, hyperglucagonemia, and decreased beta-cell proliferation and mass observed in this disease. This figure and information in its legend are with data adapted from these studies.Citation163,Citation166
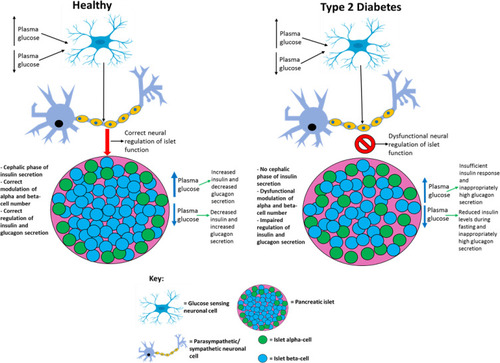
Figure 6 Speculation of how UCP2 activity and quantity is altered in T2D. In healthy individuals: UCP2 levels are basal, UCP2 is glutathionylated, ROS levels are low enough so that they do not cause cell damage but the levels are sufficient so that these molecules can amplify insulin secretion, and proton leak exists (~55% of islet beta cells’ metabolism is wasted due to proton leak which is not caused by UCP2) but is minimal, so enough of the protons can move down the gradient through ATP synthase to generate sufficient ATP levels. In T2D, UCP2 is deglutathionylated (due to increased ROS levels) and upregulated allowing for much greater proton leak. Consequently, the majority of the protons prematurely leak through the inner mitochondrial membrane and do not pass through ATP synthase, although there is likely a period before the UCP2 deglutathionylation where ATP production occurs, it is unlikely that enough ATP is generated during this time to promote adequate insulin secretion. Hence, overall ATP production is impaired in the cell resulting in the inadequate insulin secretion observed in T2D during both the postprandial period and fasting. ROS levels are likely too high (leading to cytotoxic damage) during the postprandial period as a result of severe nutrient oversupply to islet beta-cells, due to the enhanced hyperglycaemia and hyperlipidaemia in T2D during this period. The excess ROS levels result in UCP2 deglutathionylation and a subsequent dissipated PMF, meaning that ROS formation during fasting is impaired and insulin secretion is not amplified by ROS to alleviate the chronic hyperglycaemia and hyperlipidaemia in fasting T2D subjects. Although UCP2 may become glutathionylated upon ROS levels decreasing during fasting, this likely reverses during subsequent feeding as ROS levels once again become undesirably high, restarting this cycle. This figure and information in its legend are with data adapted from these studies.Citation32,Citation175,Citation178,Citation179,Citation189,Citation190,Citation329,Citation330
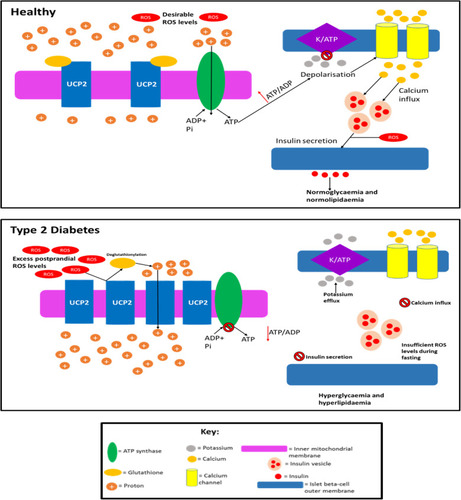
Figure 7 A summary of the pathological effects that T2D has on different organs and systems throughout the body, some of which directly contribute to the disease-associated dyslipidaemia/hyperglycaemia and subsequent clinical symptoms. This figure and information in its legend are with data adapted from these studies.Citation94,Citation105,Citation106,Citation111,Citation192–Citation195,Citation206,Citation214,Citation219–Citation222,Citation225,Citation228,Citation232,Citation241,Citation326–Citation328,Citation331
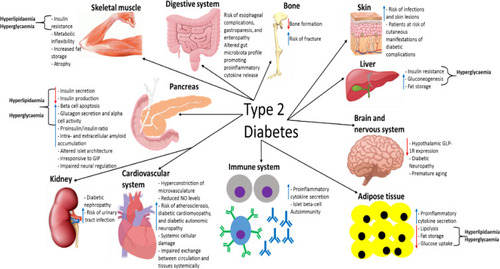
Table 3 Current Glucagon-Like Peptide 1 Receptor (GLP-1R) Agonists Used in Type 2 Diabetes Therapy
Figure 8 The amino acid sequence of GLP-1, liraglutide and exenatide. Amino acids highlighted green in exenatide indicate altered amino acids from the GLP-1 sequence. The purple amino acids in exenatide indicate amino acids that have been added. The amino acid highlighted red in liraglutide is modified by the addition of palmitic acid enabling binding to albumin which results in an increased half-life of liraglutide in circulation. This figure is with data adapted from Lorenz et al.Citation332
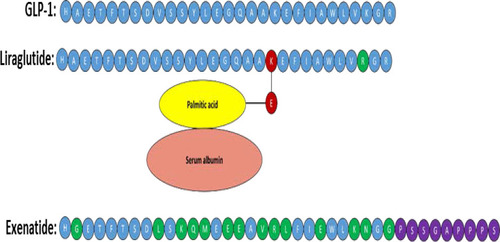
Figure 9 The chemical structure of the small molecule allosteric agonists compound 2 and compound B of GLP-1R, which shown schematically with numbered transmembrane domains. This figure is adapted with data from these studies.Citation3,Citation14