Figures & data
Table 1 Characteristics of Participants (datadryad website data)
Table 2 Characteristics of Participants (database of our hospital)
Table 3 Factors Associated with the Development of Diabetic Retinopathy (datadryad website data)
Table 4 Factors Associated with the Development of Diabetic Retinopathy (database of our hospital)
Table 5 Multivariable Logistic Regression Analysis Results of DR Related Factors (datadryad website data)
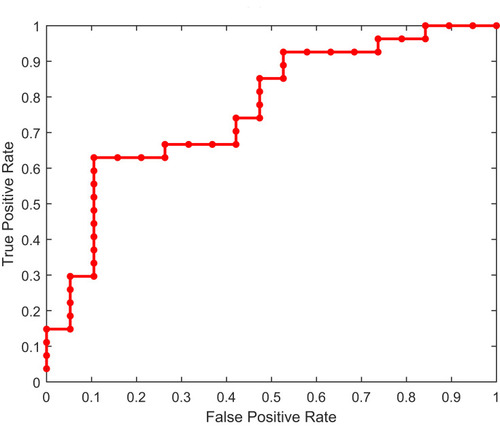
Figure 1 ROC curve of DR predicted by logistics regression model (Datadryad database).

Table 6 Multivariable Logistic Regression Analysis Results of DR Related Factors (database of our hospital)
Figure 2 ROC curve of DR predicted by logistics regression model (database of our hospital).
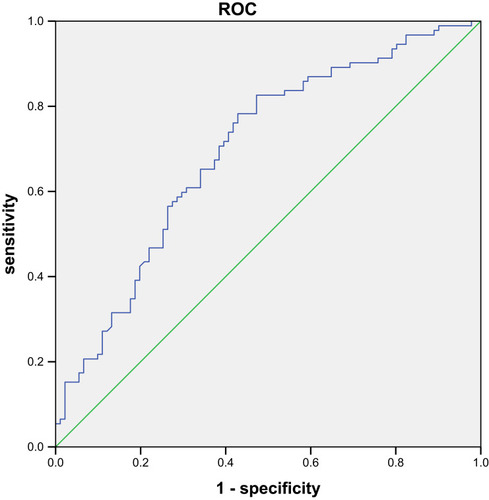
Figure 3 The BP-ANN training process.
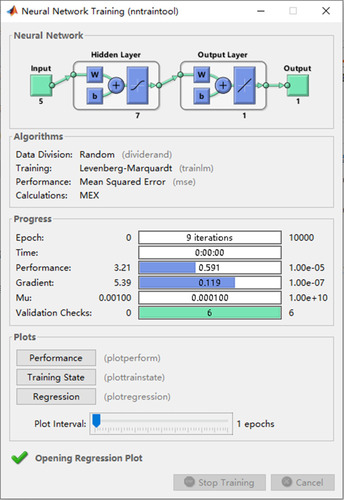
Figure 4 (A)The covariate-adjusted ROC curve by BP-ANN model to predict DR; (B) fitting performance of the BP-ANN (7 nodes hidden layer); (C) changes in parameters of the BP-ANN (7 nodes hidden layer); (D) regression performance of BP-ANN (7 nodes hidden layer).
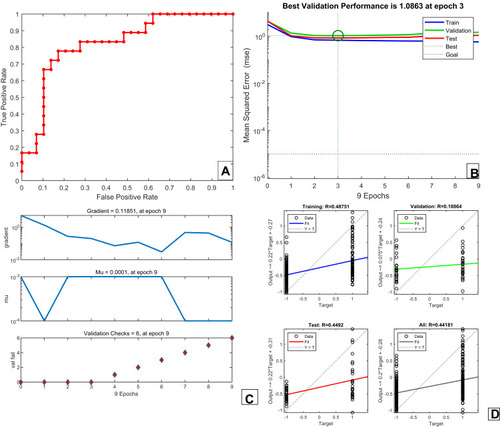
Figure 5 ROC curve of DR predicted by BP-ANN model (data of our hospital).