Figures & data
Table 1 Baseline Characteristics of Study Population
Table 2 Baseline Characteristics of Study Population According to Quartiles of CVAI and Gender
Figure 1 Kaplan-Meier plots of incidence rate of T2DM for CVAI quartiles groups during follow-up. (A) In male participants; (B) In female participants.
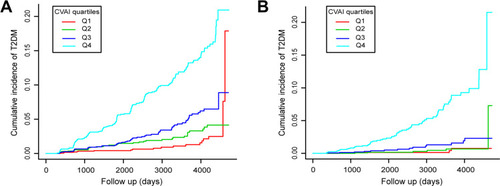
Table 3 Correlation Between CVAI and Incident T2DM in Males
Table 4 Correlation Between CVAI and Incident T2DM in Females
Figure 2 The association between CVAI and T2DM events. A nonlinear relationship was observed after adjusting for age, smoking, alcohol consumption, exercise, and fatty liver. (A) In male participants; (B) In female participants.
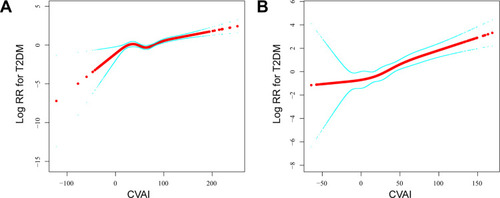
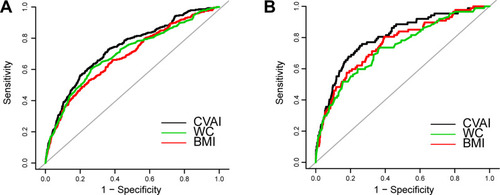
Table 5 Predictive Performance of CVAI, BMI, and WC for Incident T2DM
Figure 3 Receiver operating characteristic curves of CVAI, BMI, and WC to predict incident T2DM among study population. (A) In male participants; (B) In female participants.