
Figures & data
Figure 1 Flow chart of study participants.
Abbreviations: BMI, body mass index; BF%, body fat percentage; NWO, normal weight obesity; NWNO, normal weight non-obesity.
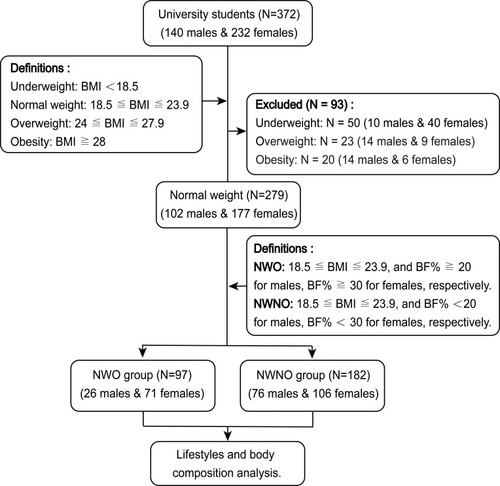
Table 1 Anthropometric Indicators and Body Composition of Participants Stratified by Sex and Body Fat Percentage
Table 2 Healthy Lifestyles Scale of University Students Stratified by Sex and Body Fat Percentage
Table 3 The Correlations Between Body Composition and Lifestyle Scores
Table 4 Multivariate Logistic Regression Analysis of University Students’ Lifestyles and NWO by Sex