
Figures & data
Table 1 Baseline Characteristics
Table 2 The Correlations Between Several Indices and Age
Figure 1 Relation between age and the P75 levels of BMI, FPG, BP, BL. (A) The association of age with P75 levels of BMI. The longevity had lower BMI levels; (B and C) The association of age with P75 levels of SBP and DBP. SBP and DBP levels in the longevity subjects were higher than in other subjects; (D) The association of age with P75 levels of FPG. The longevity subjects had higher FPG levels; (E–H) The association of age with P75 levels of TC, TG, HDL-C, and LDL-C. The BL levels were different between longevity people and others.
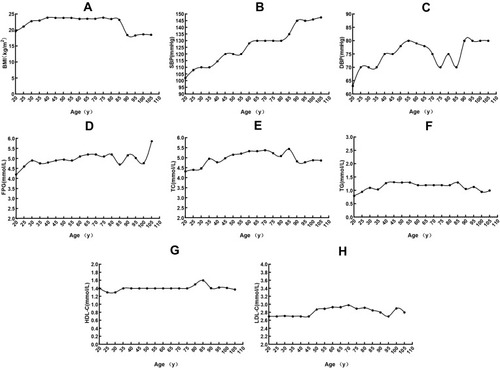
Table 3 The Distribution of Several Indicators in the Non-Longevity Population and the Longevity Population
Table 4 Reference Interval Values for FPG, BP and BL of Longevity (≥ 90 Years-Old) and Their Standard Values