
Figures & data
Table 1 Details of Institutional/Independent Ethics Committee
Figure 1 Study design of the TRC150094 Phase II study. After obtaining informed consent on visit 1, only subjects who satisfied the placebo run-in criteria at visit 3 were randomized in the ratio of 1:1:1:1.5 to the TRC150094 (25, 50, or 75 mg) or placebo till the end of the treatment (Visit 6); a follow-up was performed at the end of the study.
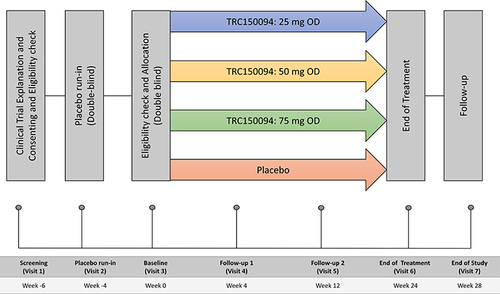
Table 2 Demographics and Baseline Characteristics
Figure 2 Subject disposition.
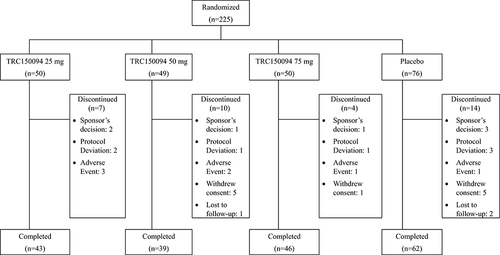
Figure 3 Effect of TRC150094 treatment on glycemic parameters, mean placebo-subtracted change from baseline in TRC150094 (25, 50, 75 mg) added to SoC at 24-week for (A) FPG (mg/dL), (B) fasting insulin, (C) HOMA-IR, (D) HbA1c. *p<0.05 change from baseline compared to placebo (Kruskal–Wallis test followed by pairwise comparison using DSCF procedure).
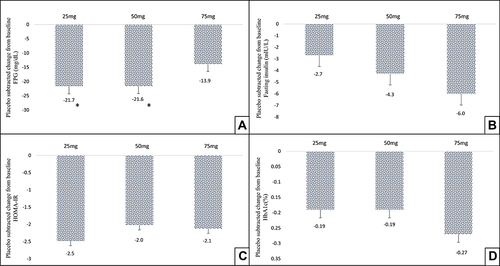
Table 3 Effect of TRC150094 Treatment on Post-Prandial Glucose (AUC0–6hr Glucose) and Insulin (AUC0–6hr Insulin)
Figure 4 Effect of TRC150094 treatment on blood pressure, (A) mean placebo-subtracted change from baseline in TRC150094 (25, 50, 75 mg) added to SoC for 24-hour MAP (mmHg) at 24-week. (B) Mean placebo-subtracted change from baseline in TRC150094 (25, 50, 75 mg) added to SoC for nighttime MAP (mmHg) at 24-week. (C) Mean placebo-subtracted change from baseline in TRC150094 (25, 50, 75 mg) added to SoC for daytime MAP (mmHg) at 24-week. *p<0.05 change from baseline compared to placebo using ANCOVA and pairwise comparison using Tukey’s test.
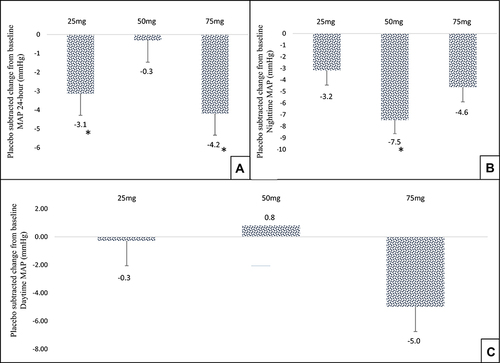
Figure 5 Effect of TRC150094 on lipid parameters, (A) mean placebo-subtracted change from baseline in TRC150094 (25, 50, 75 mg) added to SoC for various atherogenic lipid fractions 24-week, double-blind treatment period. (B) Mean placebo-subtracted change from baseline in TRC150094 (25, 50, 75 mg) in subjects not receiving statin therapy for nHDLc at 24-week.
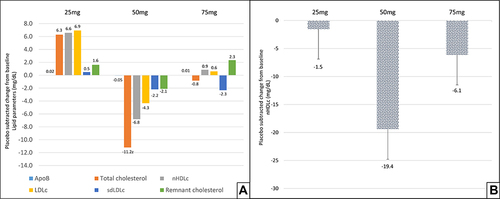
Figure 6 Effect of TRC150094 on body weight. Mean placebo-subtracted change from baseline in TRC150094 (25, 50, 75 mg) added to SoC at 24-week.
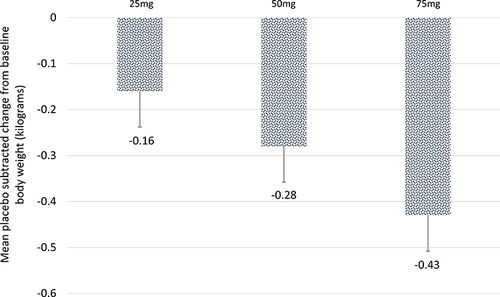
Table 4 Effect of TRC150094 Treatment on Exploratory Parameters
Table 5 Summary of Most Common (Frequency >3%) Treatment-Emergent Adverse Events (TEAE) in the Different Treatment Groups for TRC150094 (25, 50, and 75 mg) and Placebo
CAMRRI trial collaborators: list of participating investigator(s) and institution(s)