
Figures & data
Table 1 Basic Characteristics of Research Subjects
Table 2 Pearson Correlation Test Between CAP and NLR
Table 3 Spearman Correlation Test Between TE and NLR
Table 4 Multivariate Analysis of NLR and CAP Linear Regression
Table 5 Multivariate Analysis of NLR and TE Linear Regression
Figure 1 NLR ROC curve for hepatic steatosis prediction.
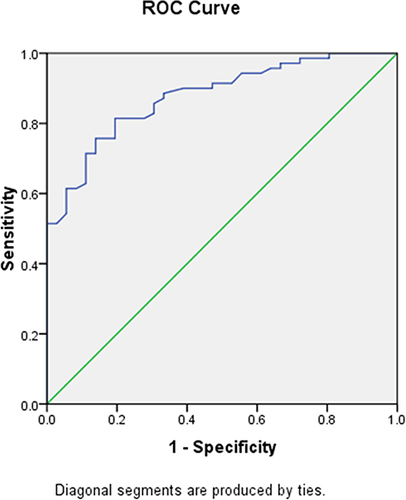
Figure 2 NLR ROC curve for hepatic fibrosis prediction.
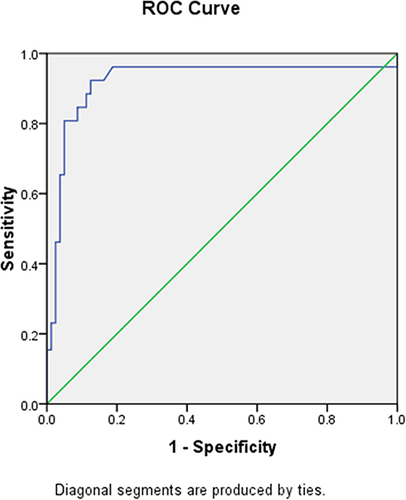
Table 6 Comparison of 2 Mean Analysis of NLR Values for the Degree of Steatosis
Table 7 Comparison of 2 Mean Analysis of NLR Values for the Degree of Fibrosis