Figures & data
Figure 1 Oral glucose tolerance test in KM mice treated with recombinant ANGPTL8/betatrophin. Oral glucose tolerance test in 8- (A), 12- (B), 15- (C), 24- (D), 36- (E), 48- (F) week-old KM mice (n = 6), and ELISA analysis of insulin concentration 30 min after glucose gavage in 12-, 24-, and 48-week-old mice (G). The experiment was repeated three times. Data represent the mean ± SD. *Indicates a significant difference at p < 0.05.
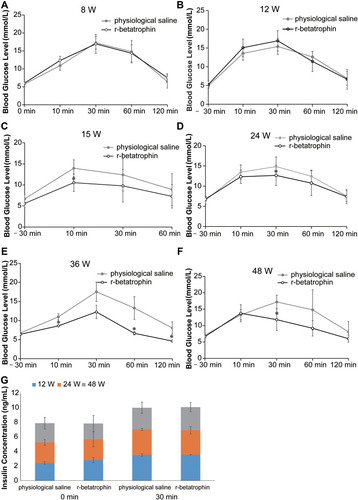
Figure 2 The ANGPTL8/betatrophin gene was knocked out in HepG2 cells using CRISPR/Cas9. (A) Schematic representation of the ANGPTL8/betatrophin gene and the target sites of CRISPR. (B) The transfection efficiency was evaluated by fluorescence microscopy. The plasmid PX458-ANGPTL8/betatrophin was transfected into HepG2 cells for 48 h. (C) T7E1 analysis of the efficiency of CRISPR-induced ANGPTL8/betatrophin mutation after two rounds of targeting. (D) Sequencing of the target region in one of the selected ANGPTL8/betatrophin knockout cell clones. M, DNA Marker C (100–1200 bp); 1, in the absence of T7E1 enzyme; 2, in the presence of T7E1 enzyme.
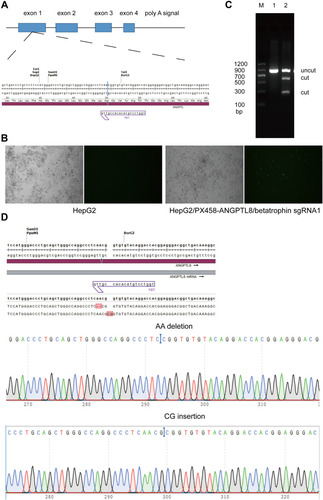
Figure 3 Cell viability of wild type HepG2 cells and HepG2 cells with ANGPTL8/betatrophin gene knockout. The symbol *Indicates p < 0.05.
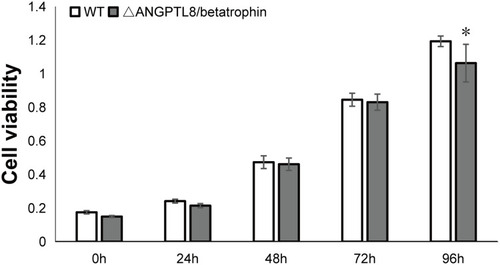
Table 1 Summary of Up-Regulated Metabolites in Response to ANGPTL8/Betatrophin Gene Knockout in HepG2/IR Cells
Figure 4 Heat map analysis of differential metabolites in HepG2/IR cells. 2 indicated that the metabolites were up-regulated, 0 not regulated and −2 down-regulated. Each experiment was performed six times.
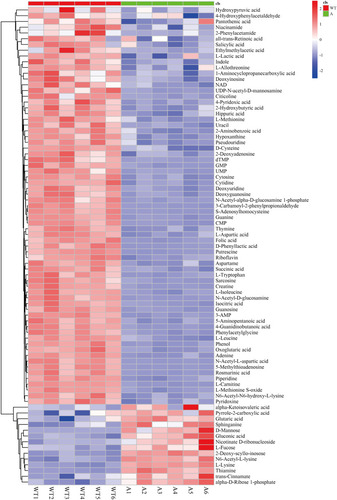
Table 2 Summary of Metabolic Pathways Significantly Affected by ANGPTL8/Betatrophin Knockout in HepG2/IR Cells
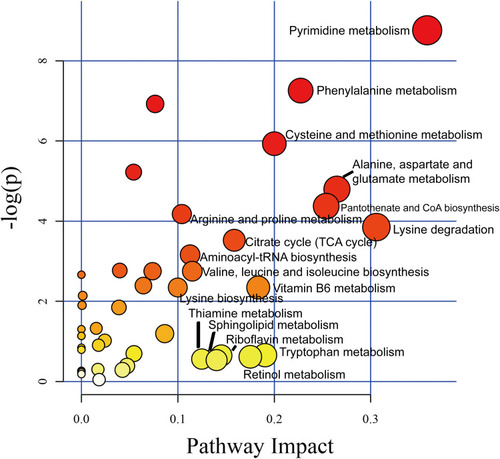
Figure 5 The impact factor map of metabolic pathways in response to ANGPTL8/betatrophin knockout in HepG2/IR cells. The metabolic pathways labeled with the name were the most obvious metabolic pathways affected by ANGPTL8/betatrophin knockout in HepG2/IR cells.