
Figures & data
Table 1 General Characteristics of the Recruited Subjects
Figure 1 Comparison of general GV and the glucose-target-rate before and after liraglutide add-on treatment. The values are presented as mean±SEM. *Represents significant difference (P<0.05).
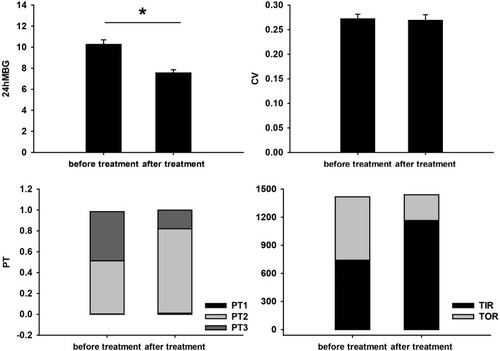
Figure 2 Comparison of within-day and day-to-day GV before and after liraglutide add-on treatment. The values are presented as mean±SEM. *Represents significant difference (P<0.05).
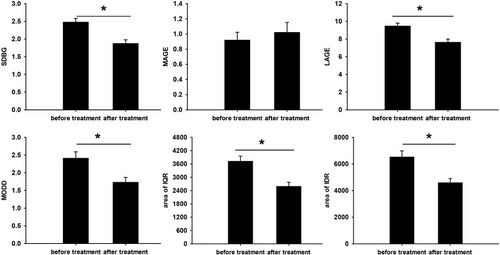
Figure 3 Comparisons of mean blood glucose levels and AUCs before and after liraglutide add-on treatment. Mean blood glucose levels: (A) during the day; (B) at nocturnal period; (C) at fasting period; (D) after BF; (E) after lunch; (F) after dinner. AUC: (G) at nocturnal and fasting periods; (H) at postprandial periods. The values are presented as mean±SEM. *Represents statistically different AUC in this time period (P<0.05).
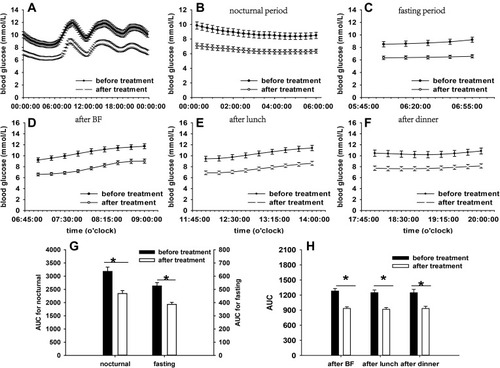
Table 2 The Incidence of Hypoglycaemia Before and After Treatment
Table 3 Comparison of Metabolic Indicators Before and After Treatment