Figures & data
Figure 1 The flow chart of patient inclusion and analysis procedures in the study. aThe participants with at least three times fasting blood glucose records. bThe particients with newly-diagnosed diabetes.
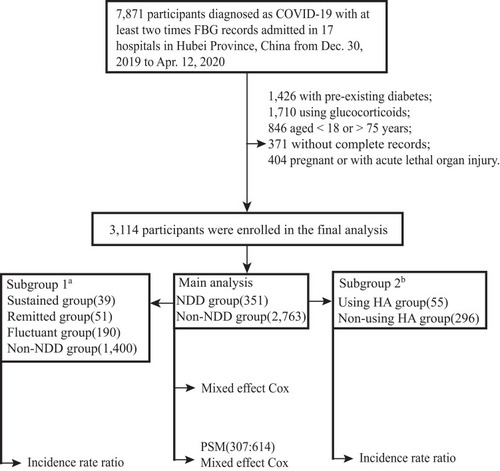
Table 1 Characteristics of COVID-19 Patients in the Newly-Diagnosed Diabetes (NDD) and Non-NDD Groups Before and After Propensity Score Matching
Figure 2 Dynamic profiles of BG (A), neutrophils (B), lymphocytes (C), LDH (D), TNFα (E), and IL-6 (F) in NDD and Non-NDD groups during hospitalization. aThe relative levels of LDH, TNFα and IL-6 were applied and normalized according to their upper limits of the normal range in each hospital.
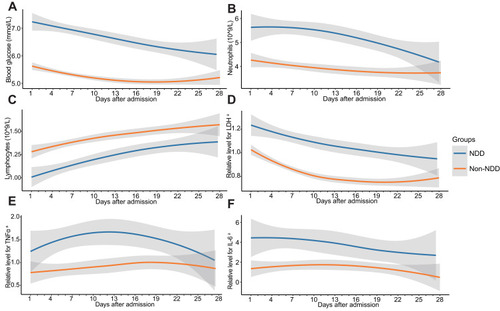
Table 2 Hazard Ratios for Outcomes in NDD and Non-NDD Groups Under Cox Adjusted Model and Propensity Score Matching Model
Figure 3 Kaplan-Meier curves for cumulative probability of COVID-19 mortality during hospitalization in NDD and Non-NDD groups in the propensity score-matched model.
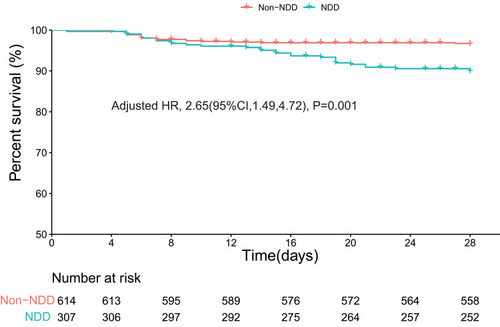
Table 3 Association of Dynamic Blood Glucose Patterns with 28-Day Poor Outcomes in Patients with NDD
Figure 4 Survival curves of newly-diagnosed diabetes patients with sustained, fluctuant, and remitted blood glucose levels.
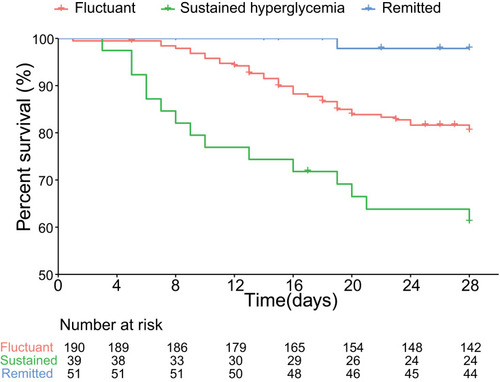
Table 4 Association of Hypoglycemic Agents (HA) Use with 28-Day Poor Outcomes in Patients with NDD
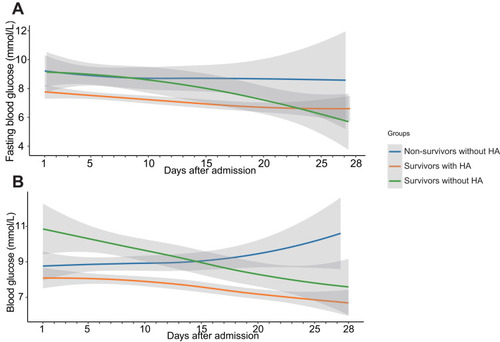
Figure 5 Dynamic profiles of fasting blood glucose (A) and blood glucose (B) in survivors with HA, survivors without HA, and non-survivors without HA from patients with newly-diagnosed diabetes during hospitalization.