
Figures & data
Figure 1 Mitochondrial dysfunction plays a central role leading to metabolic perturbations in different organ systems, including skeletal muscle, heart, the liver, brain, adipose tissue, pancreas, and blood vessels. Metabolic disturbances, including insulin resistance, dysglycemia, dyslipidemia, and hypertension, act as a metabolic driver concurrently and independently to produce different stages of DBCD/ CMBCD. The four stages of DBCD and CMBCD are depicted at the bottom.
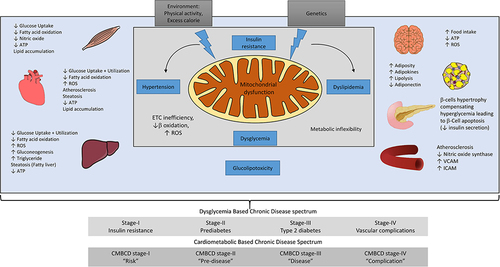
Figure 2 The atherogenic lipoprotein consists of chylomicrons, VLDL-C, IDL-C, and LDL-C.
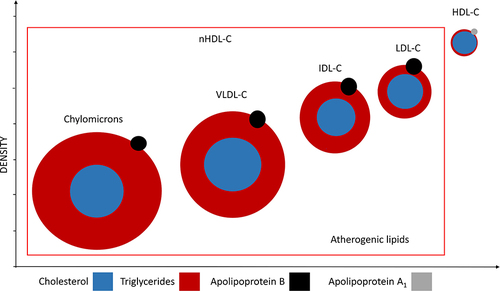
Figure 3 Targets for nHDL modification to reduce cardiovascular risk. The nHDL targets should be 2.6 mmol/L (less than 100 mg/dL) and 3.3 mmol/L (less than 130 mg/dL) in those at very high and high total CV risk, respectively, as per the 2019 ESC/EAS Guidelines for the management of dyslipidemia.
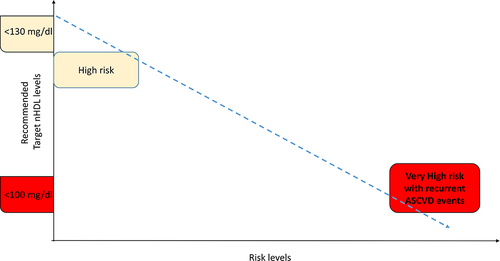
Figure 4 JBS3 risk score (65%) identified the highest proportion of patients as “high risk,” ie, >20% 10-year cardiovascular risk vs ACC/AHA risk score (28.9%), FRS (46.3%), WHO risk score (21.3%).
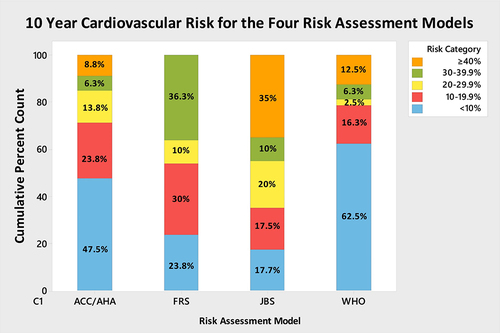
Table 1 Summary of Medication Used for Treatment of Type 2 Diabetes Mellitus