Figures & data
Figure 1 Weight-related changes and transplantation of labeled B-ASCs and W-ASCs. (A) Body weight. (B) Daily food intake. (C) Labeled ASCs (100×). (D) Visceral fat weight. (E) Abdominal fat weight. Data are from four independent experiments (n = 10) and reported as means ± standard deviation. Statistical analysis was conducted with GraphPad Prism 9 software.**P < 0.01; ****P < 0.0001.
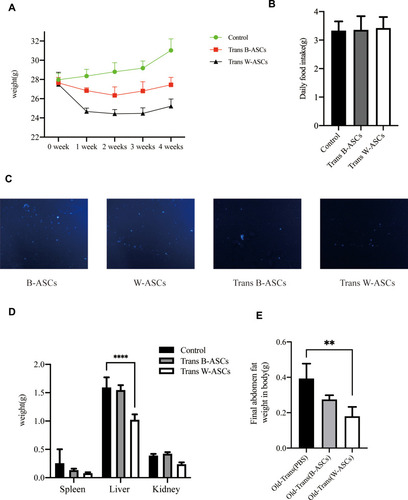
Figure 2 Effect of B-ASC and W-ASC transplantation on lipid metabolism. (A) Hematoxylin and eosin staining of paraffin-embedded abdominal adipose tissue. (B) The size of fat droplets in abdominal adipose tissue. (C) Blood lipid levels. (D) Mitochondrial activity in abdominal adipocytes. Data are from four independent experiments (n = 5) and reported as means ± standard deviation. Statistical analysis was conducted with GraphPad Prism 9 software. *P < 0.05; ***P < 0.001.
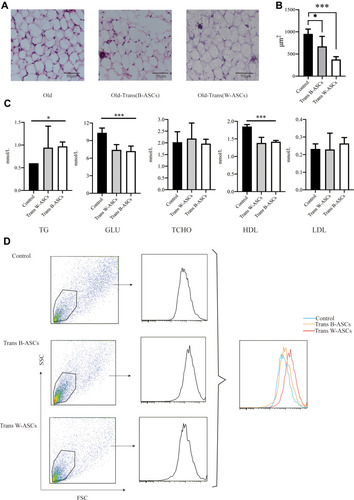
Figure 3 Antiaging effects of B-ASC and W-ASC transplantation. (A) Serum levels of superoxide dismutase (SOD), catalase (CAT), sex hormone-binding globulin (SHBG), and thyroid stimulating hormone (TSH). (B) Senescence-associated beta-galactosidase staining of ASCs from all study groups. Data are from four independent experiments (n = 7) and reported as means ± standard deviation. Statistical analysis was conducted with GraphPad Prism 9 software. *P < 0.05; **P < 0.01; ***P < 0.001.
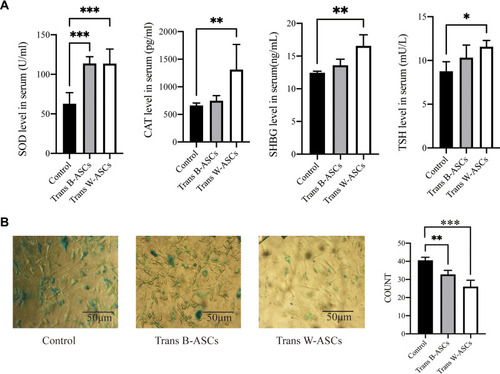
Figure 4 Serum cytokine concentrations. Data are mean ± standard deviation (n = 8). Statistical analysis was conducted with GraphPad Prism 9. *P < 0.05; ***P < 0.001.
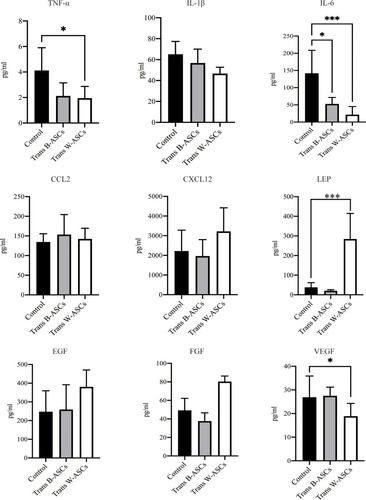
Figure 5 Effects of B-ASC and W-ASC transplantation on the plasticity of abdominal ASCs. (A) MTT assay of cell proliferation. (B) Colony count. (C) Osteogenic differentiation. (D) Adipogenic differentiation. Data are means ± standard deviation (n = 5). Statistical analysis was conducted with GraphPad Prism 9. *P < 0.05; **P < 0.01; and ***P < 0.001.
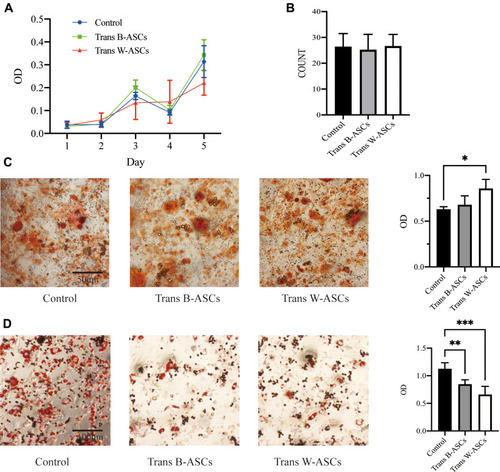
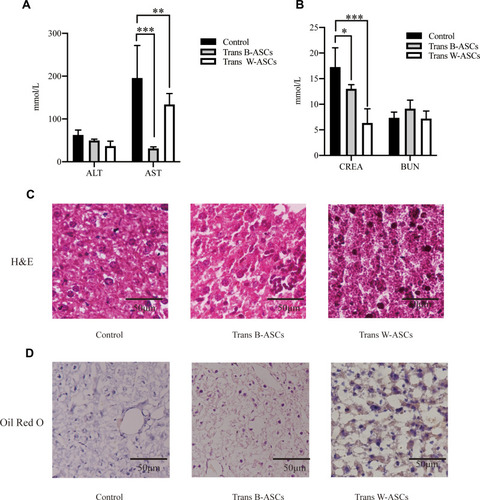
Figure 6 Effects of B-ASC and W-ASC transplantation on liver and kidney function. (A) ALT and AST levels. (B) CREA and BUN levels. (C) Liver tissue, hematoxylin and eosin staining of paraffin sections. (D) Frozen sections of liver tissue, Oil Red O staining. Data are means ± standard deviation (n = 5). Statistical analysis was conducted with GraphPad Prism 9. *P < 0.05; **P < 0.01; and ***P < 0.001.