Figures & data
Table 1 Primer Sequences
Figure 1 The volcano diagram of differential expression.
Notes: The differences in the results from the comparison were reflected in the volcano diagram, with the gray and blue corresponding to non-significantly differential expression genes and red corresponding to significantly differential expression genes. The horizontal axis demonstrated the log2 Fold-Change, and the direction of the vertical axis demonstrated the log10 P.
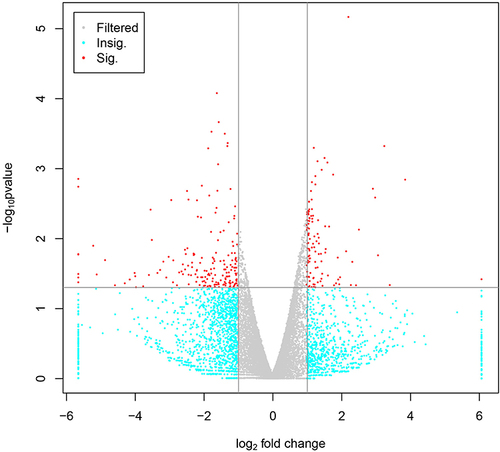
Figure 2 The cluster diagram of differential expression.
Notes: Red represented for the high-expression transcripts, green for the low-expression transcripts.
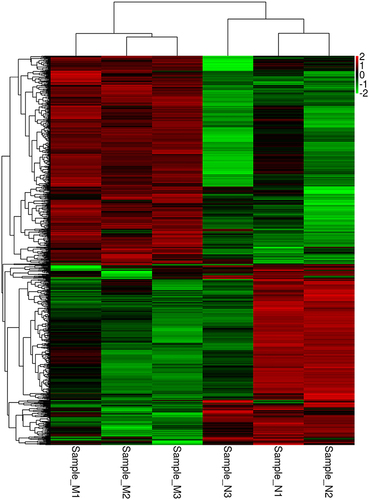
Figure 3 Functional annotation and enrichment analysis.
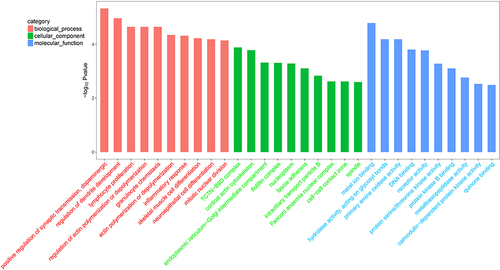
Figure 4 The results of KEGG annotation.
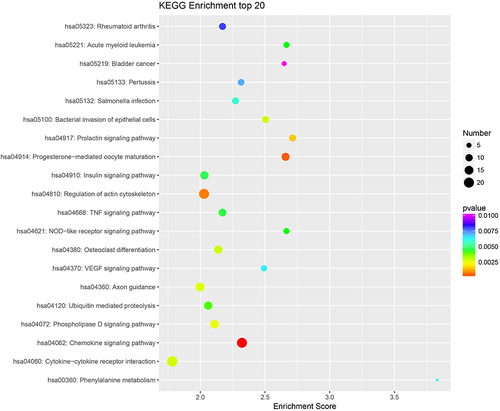
Table 2 The Results of Screening of the Differentially Expressed Genes
Table 3 The mRNA Expression Analysis in the Validation of Candidate Genes (, n=20)
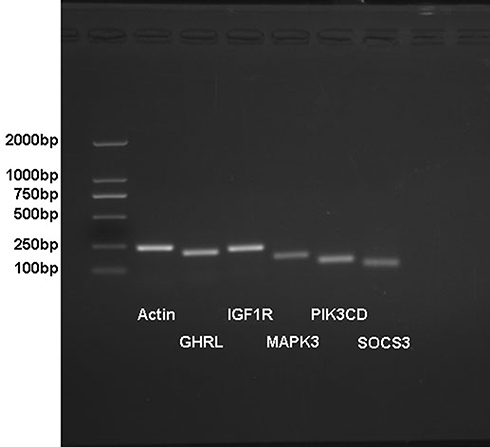
Figure 5 The electropherogram of PCR primer identification.
Notes: The sizes of the PCR product of the tested genes GHRL, IGF1R, MAPK3, PIK3CD, SOCS3 and the internal reference gene actin were identified separately in the figure. The product sizes in the figure correspond to the fragment lengths of the tested genes with a single product band.