Figures & data
Figure 1 Effects of BSR on body weight of db/db DN mice. Animals were assigned into six group (n = 25): control group (db/m), model group (db/db-m), positive group (db/db-me) and BSR at high- (db/db-hd), medium- (db/db-md) and low (db/db-ld) doses group. The data are shown as the mean±SD.
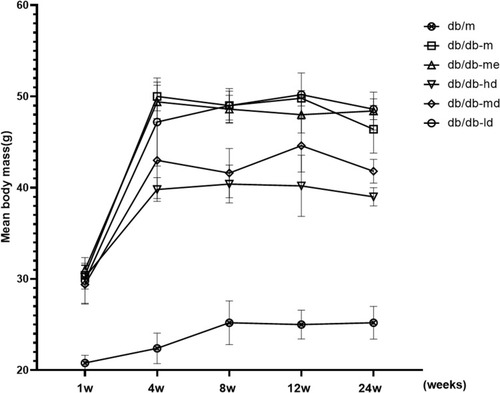
Figure 2 Effects of BSR on blood glucose of db/db DN mice (mmol/L). Animals were assigned into six group (n = 25): control group (db/m), model group (db/db-m), positive group (db/db-me) and BSR at high- (db/db-hd), medium- (db/db-md) and low (db/db-ld) doses group. The data are shown as the mean±SD.
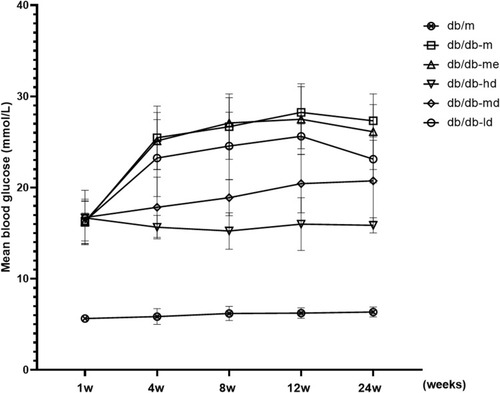
Figure 3 Effect of BSR on the UAER of db/db DN mice (mg/24-hours). Animals were assigned into six group (n = 25): control group (db/m), model group (db/db-m), positive group (db/db-me) and BSR at high- (db/db-hd), medium- (db/db-md) and low (db/db-ld) doses group. The data are shown as the mean±SD.
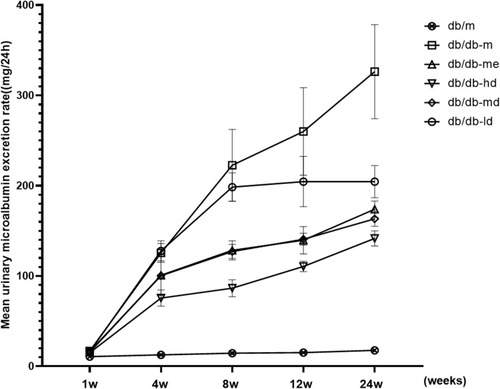
Figure 4 Effect of BSR on blood urea nitrogen level of db/db DN mice (mg/24-hours). Animals were assigned into six group (n = 25): control group (db/m), model group (db/db-m), positive group (db/db-me) and BSR at high- (db/db-hd), medium- (db/db-md) and low (db/db-ld) doses group. The data are shown as the mean±SD.
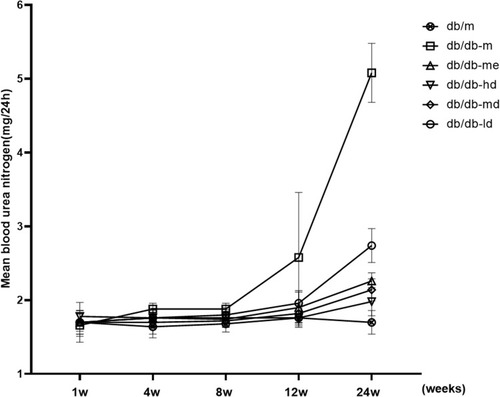
Figure 5 Effect of BSR on serum creatinine level of db/db DN mice (mg/24-hours). Animals were assigned into six group (n = 25): control group (db/m), model group (db/db-m), positive group (db/db-me) and BSR at high- (db/db-hd), medium- (db/db-md) and low (db/db-ld) doses group. The data are shown as the mean±SD.
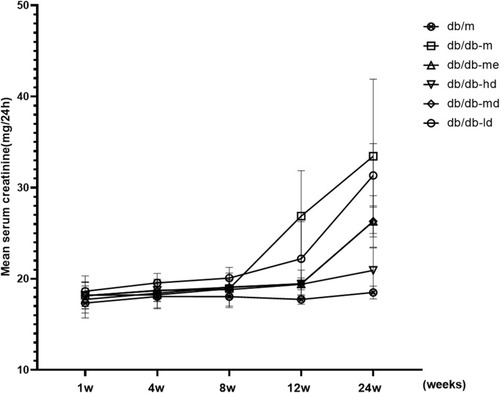
Figure 6 Pathological changes of DN in db/db mice treated with BSR for 24 weeks. Animals were assigned into six group (n = 25): control group (db/m), model group (db/db-m), positive group (db/db-me) and BSR at high- (db/db-hd), medium- (db/db-md) and low (db/db-ld) doses group. The data are shown as the mean±SD.
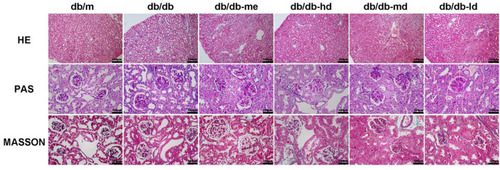
Table 1 Effect of BSR on Mesangial Matrix Dilation Score of db/db DN Mice (After 24 Weeks of Treatment)
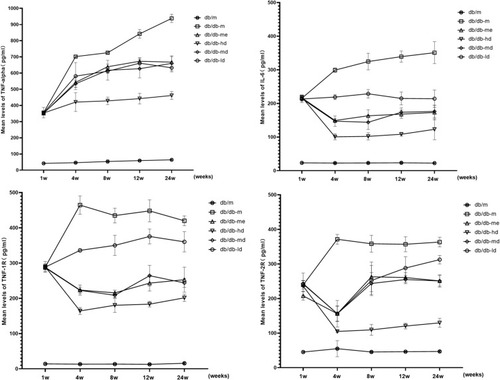
Table 2 Effects of BSR on the Levels of IL-6 in Renal Tissue Homogenate of db/db Mice (pg/mL)
Table 3 Effects of BSR on the Levels of TNF-α in Renal Tissue Homogenate of db/db Mice (pg/mL)
Table 4 Effects of BSR on the Levels of TNF-1R in Renal Tissue Homogenate of db/db Mice (pg/mL)
Table 5 Effects of BSR on the Levels of TNF-2R in Renal Tissue Homogenate of db/db Mice (pg/mL)
Figure 7 Effects of BSR on the levels of TNF-α, IL-6, TNF-1R and TNF-2R in renal tissue homogenate of db/db mice (pg/mL). Animals were assigned into six group (n = 25): control group (db/m), model group (db/db-m), positive group (db/db-me) and BSR at high- (db/db-hd), medium- (db/db-md) and low (db/db-ld) doses group. The data are shown as the mean±SD.