
Figures & data
Table 1 Demographic and Clinical Characteristics at Baseline According to Intensification of Insulin Injection
Figure 1 Selection of the study population. *Overlapped patient, n=1; patient administered prior to the contract date, n=1; written consent form unavailable, n=3; inclusion criteria violation, n=59; contents of investigation unclear, n=32; HbA1c not available, n=53. **Three patients did not have HbA1c measurements, as they were not administered insulin or oral hypoglycemic agents at Visit.
Abbreviations: HbA1c, glycated hemoglobin; n, number of patients analyzed; N, total number of patients.
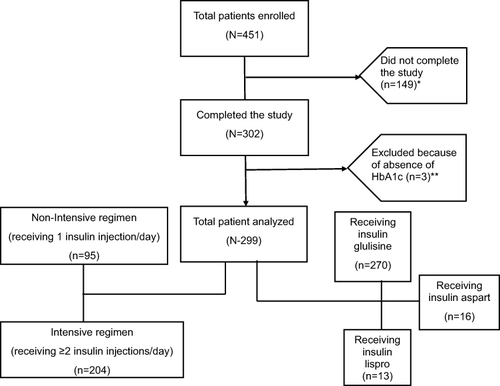
Table 2 Changes in HbA1c, FPG, PPG, and Body Weight with Use of Insulin Glulisine
Table 3 Change in HbA1c and Body Weight Over 6 Months in the Intensive vs Non-Intensive Group