
Figures & data
Figure 1 Flowchart of study participants.
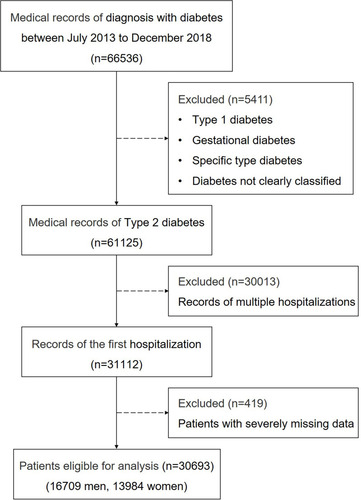
Table 1 Descriptive Characteristics of the Study Sample at Classified by BMI
Table 2 Incidence Rates and ORs for CHD According to BMI by History of HP in Patients with Type 2 Diabetes
Figure 2 Prevalence of coronary heart disease in patients with type 2 diabetes by cardiovascular risk factors and body mass index levels. Patients were classified according to the history of hypertension (A), HbA1c (B), Lpa (C) and smoking (D).
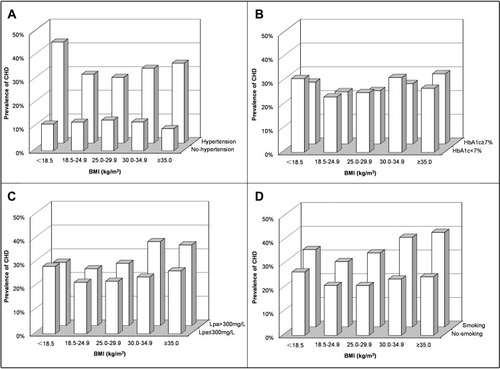
Figure 3 Additive interaction of BMI and hypertension on risk of CHD by BMI presented as odds ratio partitioned into relative excess risks due to BMI, hypertension, and their interaction.
Abbreviations: BMI, body mass index; CHD, coronary heart disease; HP, hypertension; U, BMI 18.5 to <25.0 kg/m2 and without hypertension; RERI, relative excess risk due to interaction; FBG, fasting blood-glucose; HbA1c, glycosylated hemoglobin; LDL-C, low-density lipoprotein cholesterol; SCr, serum creatinine; SUA, serum uric acid.
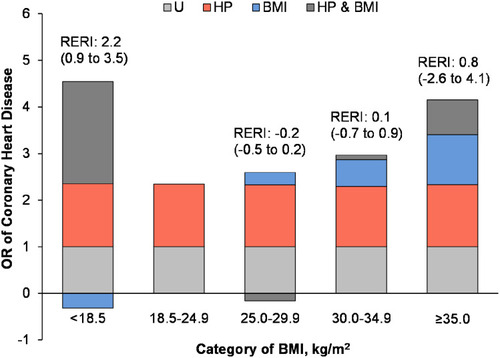
Table 3 Statistics for Additive Interaction Between BMI and HP in Multivariable-Adjusted Models of Incident CHD in Patients with Type 2 Diabetes Mellitus