
Figures & data
Figure 1 Flowchart for inclusion of participants.
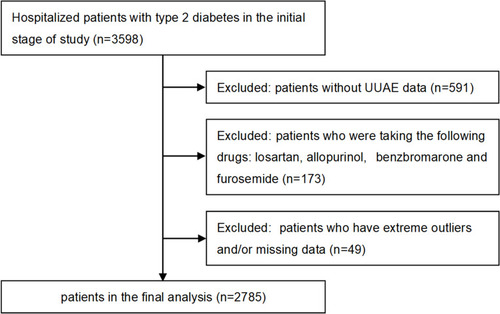
Table 1 Characteristics of the Patients According to UUAE Quartiles
Table 2 Comparison of Characteristics Between Men and Women Subjects
Figure 2 Prevalence of obesity in T2D. (A) Comparison of the obesity prevalence between men and women with T2D after adjusting for age and DD. (B) Prevalence of abdominal obesity prevalence between men and women with T2D after adjusting for age and DD. (C) Prevalence of obesity stratified by age in T2D. (D) Prevalence of abdominal obesity stratified by age in T2D. (E) Prevalence of obesity stratified by DD in T2D. (F) Prevalence of abdominal obesity stratified by DD in T2D.
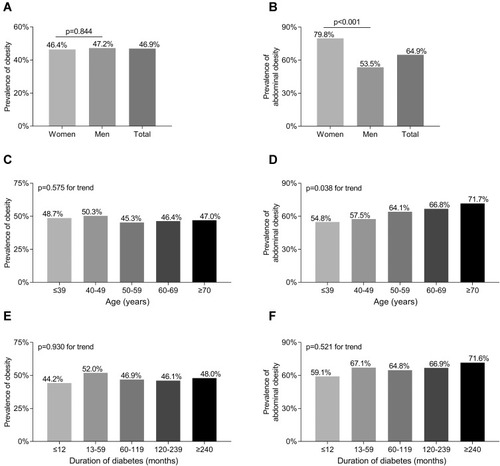
Figure 3 Comparisons of obesity prevalence and UUAE levels. (A) Comparison of the prevalence of obesity among the UUAE quartile groups after adjusting for age, sex, and DD. (B) Comparison of the prevalence of moderate-severe obesity among the UUAE quartile groups after adjusting for age, sex, and DD. (C) Comparison of the prevalence of abdominal obesity among the UUAE quartile groups after adjusting for age, sex, and DD. (D) Comparison of the prevalence of moderate-severe abdominal obesity among the UUAE quartile groups after adjusting for age, sex, and DD.
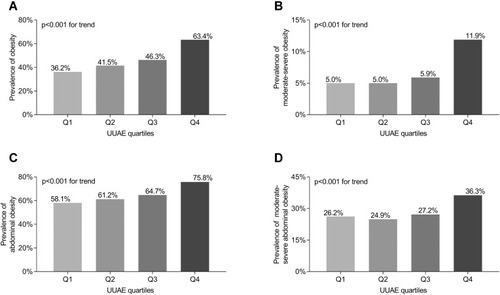
Figure 4 Comparisons of UUAE levels. (A) Comparison of UUAE levels between the patients with and without obesity after adjusting for age, sex, and DD. (B) Comparison of UUAE levels between the patients with and without moderate-severe obesity after adjusting for age, sex, and DD. (C) Comparison of UUAE levels between the patients with and without abdominal obesity after adjusting for age, sex, and DD. (D) Comparison of UUAE levels between the patients with and without moderate-severe abdominal obesity after adjusting for age, sex, and DD.
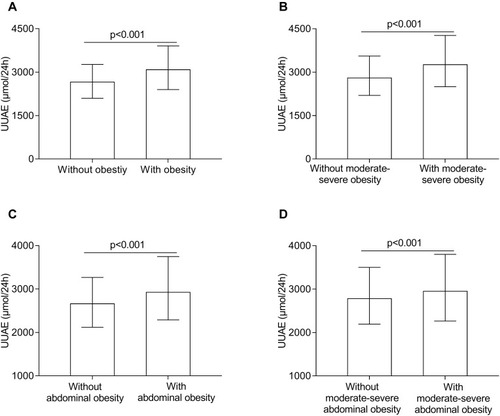
Table 3 Association of UUAE Quartiles with Obesity and Abdominal Obesity
Table 4 Association of UUAE with Obesity and Abdominal Obesity Among CKD and Non-CKD Patients