
Figures & data
Table 1 Minimum Sample Size Using Covariates Associated with CKD in JUMC Southwest Ethiopia, 2020
Table 2 Socio-Demographic, Clinical and Physiologic Characteristics of DM Patients on Treatment at Jimma University Medical Center, Southwest Ethiopia, 2020
Figure 1 Flowchart of DM patients on treatment at Jimma university medical center, Southwest Ethiopia, 2012 to 2020.
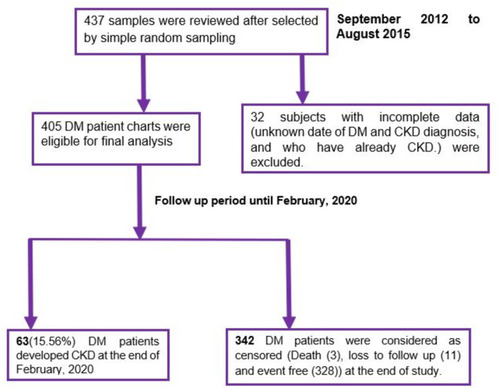
Figure 2 Overall Kaplan Meier of survival curves for DM patients on treatment at Jimma university medical center, Southwest Ethiopia, 2012 to 2020.
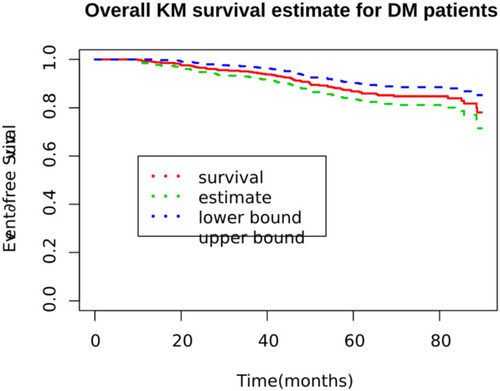
Figure 3 Kaplan–Meier of survival curves by HTN status for DM patients on treatment at Jimma university medical center, Southwest Ethiopia, 2012 to 2020.
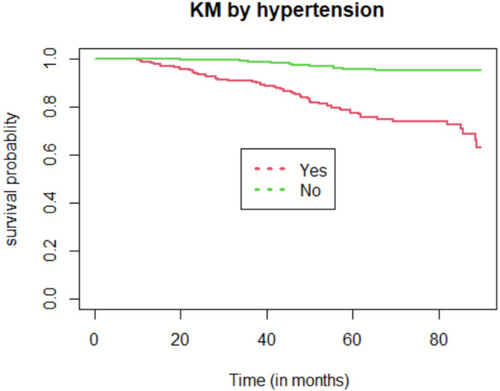
Table 3 Multivariable Cox Regression Results for Predictors of CKD among DM Patients on Treatment at Jimma University Medical Center, Southwest Ethiopia, 2020