
Figures & data
Table 1 Clinical Characteristics in 467 Patients with Type 2 Diabetes at Baseline
Table 2 Cox Proportional Hazard Analysis for the Association Between Urinary and Serum Angiotensinogen Levels and Stroke Events in Patients with Type 2 Diabetes
Figure 1 Kaplan–Meier analysis of the endpoint-free curve stratified into 2 groups by median level of the eGFR.
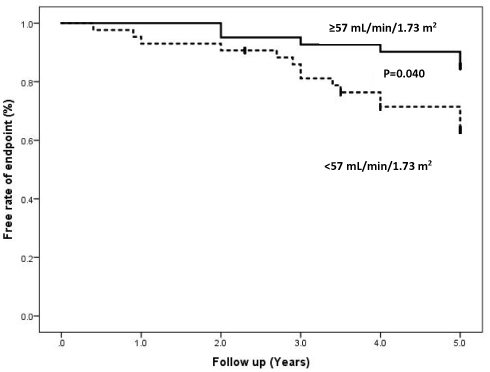
Table 3 Sensitivity Analysis for the Association Between Urinary and Serum Angiotensinogen Levels and Stroke Events in Patients with Type 2 Diabetes
Table 4 Stratified Analysis for the Association Between Urinary and Serum Angiotensinogen Levels and Stroke Events in Patients with Type 2 Diabetes by “Taking RAS Inhibitors”
Table 5 Stratified Analysis for the Association Between Urinary and Serum Angiotensinogen Levels and Stroke Events in Patients with Type 2 Diabetes by “Egfr≥60 mL/Min/1.73 M2”