Figures & data
Table 1 Sample Characteristics
Table 2 Gender Differences in the Prevalence in the Individual Components of MetS
Table 3 Model 1 (MetS Prediction Model Consisting of Gender, Father’s Social Class at Birth and High Waist Circumference)
Table 4 Model 2 (MetS Prediction Model Consisting of Gender, Father’s Social Class at Birth, High Waist Circumference and HbA1c ≥6.0)
Table 5 Model 3 (MetS Prediction Model Consisting of Gender, Father’s Social Class at Birth, BMI at 7, HbA1c ≥6.0 and Low HDL-Cholesterol)
Table 6 Model 4 (MetS Prediction Model Consisting of Gender, Father’s Social Class at Birth, BMI at 7, HbA1c ≥6.0, Hypertension and Overcrowding)
Table 7 Model 5 (MetS Prediction Model Consisting of Gender, Father’s Social Class at Birth, BMI at 7, Hypertension and HDL-Cholesterol)
Table 8 Model 6 (MetS Prediction Model Consisting of Gender, Father’s Social Class at Birth, BMI at 7, HbA1c ≥6.0, Hypertension, High Serum Triglycerides and Overcrowding)
Table 9 Model 7 (MetS Prediction Model Consisting of Gender, Father’s Social Class at Birth, BMI at 7, Hypertension and High Serum Triglycerides)
Table 10 Model 8 (MetS Prediction Model Consisting of Father’s Social Class at Birth, High Waist Circumference and Hypertension)
Table 11 Model 9 (MetS Prediction Model Consisting of Gender, Father’s Social Class at Birth, Family History of T2DM and High Waist Circumference)
Table 12 Model 10 (MetS Prediction Model Consisting of Gender, BMI at 23 and High Waist Circumference)
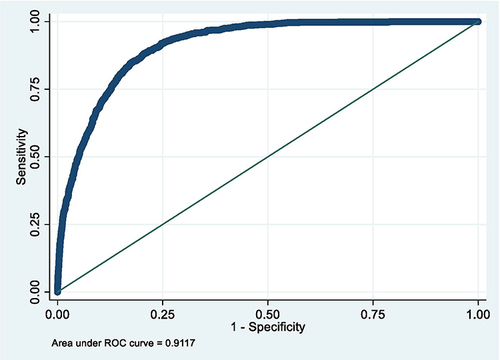
Figure 1 ROC curve of Model 1 (MetS prediction model consisting of gender, father’s social class at birth and high waist circumference).
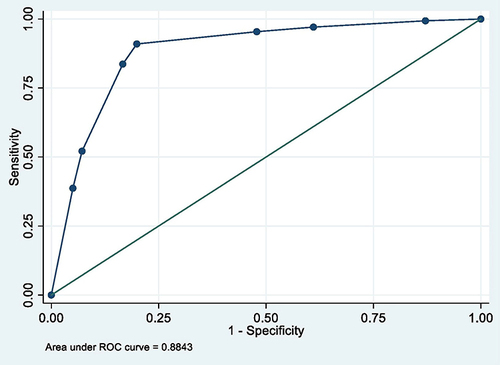
Figure 2 ROC curve of model 2 (MetS prediction model consisting of gender, father’s social class at birth, high waist circumference and HbA1c ≥6.0).
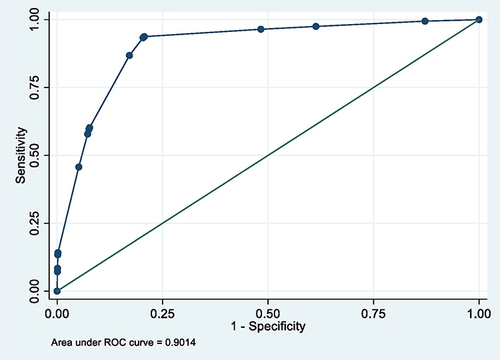
Figure 3 ROC curve of Model 3 (MetS prediction model consisting of gender, father’s social class at birth, BMI at 7, HbA1c ≥6.0 and low HDL-cholesterol).
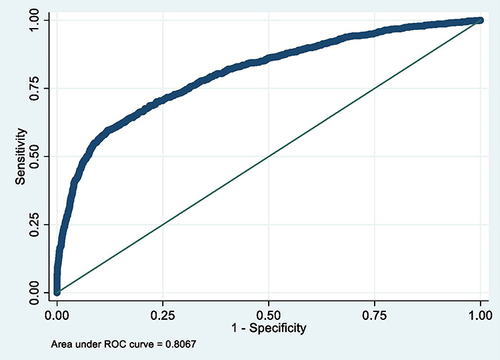
Figure 4 ROC curve of Model 4 (MetS prediction model consisting of gender, father’s social class at birth, BMI at 7, HbA1c ≥6.0, hypertension and overcrowding).
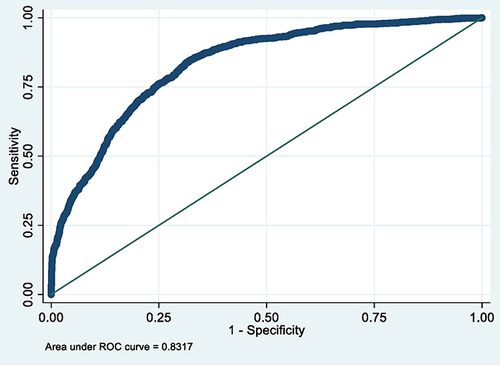
Figure 5 ROC curve of Model 5 (MetS prediction model consisting of gender, father’s social class at birth, BMI at 7 and hypertension).
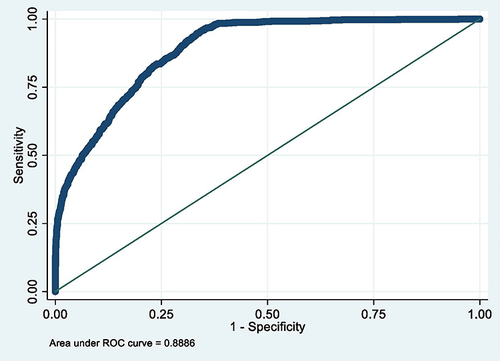
Figure 6 ROC curve of Model 6 (MetS prediction model consisting of gender, father’s social class at birth, BMI at 7, HbA1c ≥6.0, hypertension, high serum triglycerides and overcrowding).
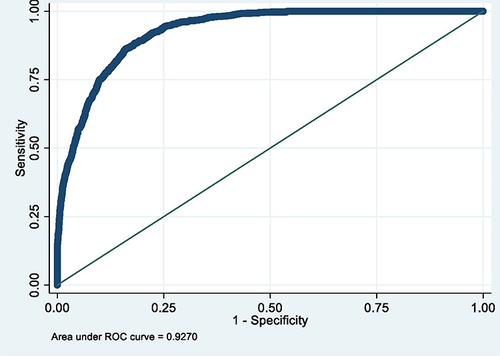
Figure 7 ROC curve of Model 7 (MetS prediction model consisting of gender, father’s social class at birth, BMI at 7, hypertension and high serum triglycerides).
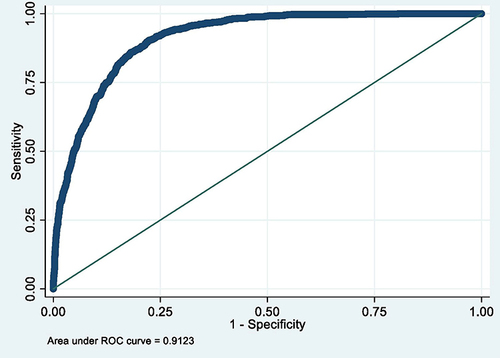
Figure 8 ROC curve of Model 8 (MetS prediction model consisting of father’s social class at birth, high waist circumference and hypertension).
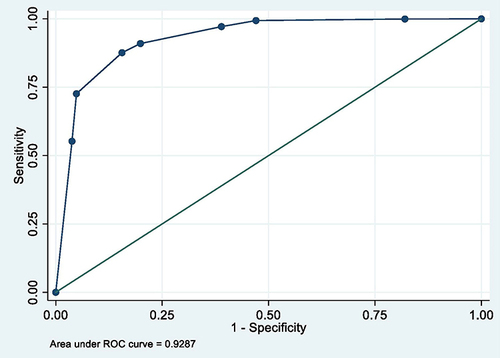
Figure 9 ROC curve of Model 9 (MetS prediction model consisting of gender, father’s social class at birth, family history of T2DM and high waist circumference).
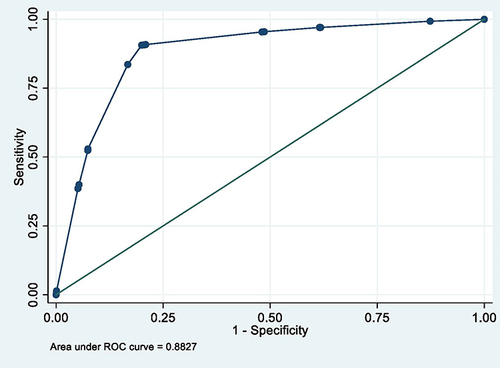
Figure 10 ROC curve of Model 10 (MetS prediction model consisting of gender, BMI at 23 and high waist circumference).
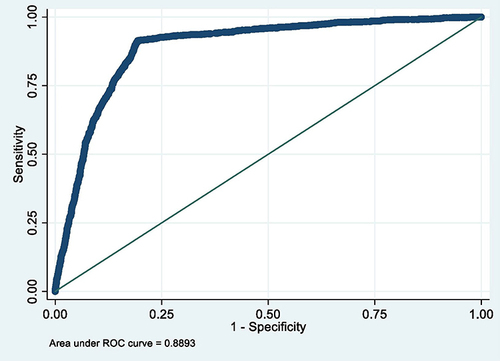
Table 13 Summary of the Performance Parameters of the Ten (10) MetS Models Developed
Table 14 Selected Model (Model 7) Adjusted for Confounders
Figure 11 ROC of selected model after controlling for possible confounders.
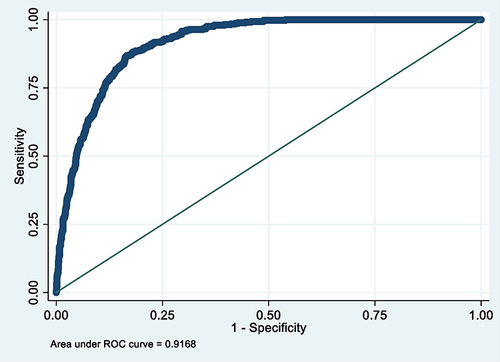
Table 15 Selected Model (Model 7) Applied on a Random Bootstrap Sample
Table 16 Summary Performance of the Selected Model (Model 7) Applied on a Random Bootstrap Sample
Figure 12 ROC curve of selected model applied on a random bootstrap sample.