Figures & data
Table 1 Comparison of Demographic and Clinical Features on Admission of DKA Group and Non-DKA Group
Table 2 Comparison of Laboratory Findings of DKA Group and Non-DKA Group
Table 3 Comparison of the Clinical Course of DKA Group and Non-DKA Group
Table 4 Comparison of the Etiologies of AP
Table 5 Comparison of Risk Assessment Scores of DKA Group and Non-DKA Group
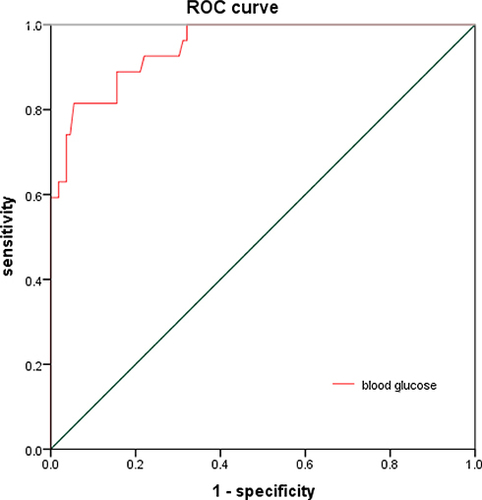
Table 6 AUC for Blood Glucose Identifying Concomitant DKA in T2DM Patients with AP
Table 7 Cut-off Value of Blood Glucose for Identifying Concomitant DKA in T2DM Patients with AP
Figure 1 ROC curve analysis for sensitivity and specificity of blood glucose for diagnosis of concomitant DKA. ROC curve, receiver operating characteristics curve. The surface area under the curve for blood glucose identifying concomitant DKA was 0.949 (95% CI, 0.909–0.988).