
Figures & data
Table 1 Multiple Linear Regression Analyses of the Relationship Between BCAAs and SOD(A) or MDA(B) in Different Glucose Metabolism Groups
Table 2 Characteristics of the Study Participants (n=816)
Table 3 Comparison of Clinical Parameters According to the Level of L-Val Quartiles (n=816)
Figure 1 Association between L-Val, MDA and HOMA-IR.
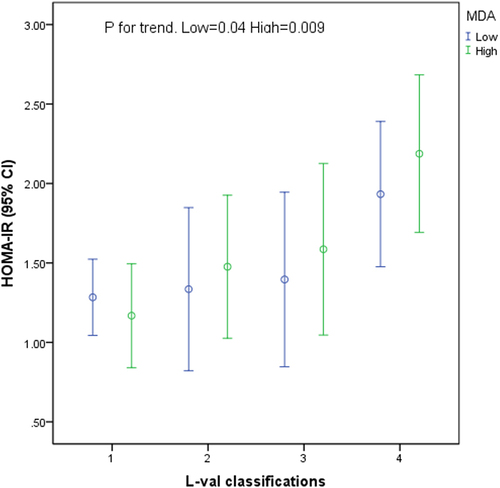
Table 4 Multiple Logistic Regression Analyses of the Relationship Between L-Val, MDA and NDM