Figures & data
Figure 1 Characteristics of mice fed a normal or high-fat diet: (A) body weight; (B) LEE index; (C) food accumulation; (D) liver and kidney index; (E) TC and TGs; (F) HOMA-IR. Data presented as means ± SEM. Ten mice per group. Statistical analysis was performed using one-way ANOVA. *P<0.05; **P<0.01; ***P<0.001.
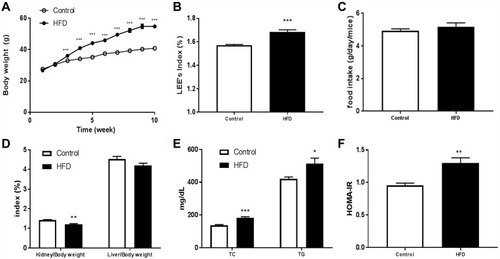
Figure 2 Total-ion chromatograms in positive-ion mode (A, C) and negative-ion mode (B, D) in serum samples of normal controls and high-fat diet mice.
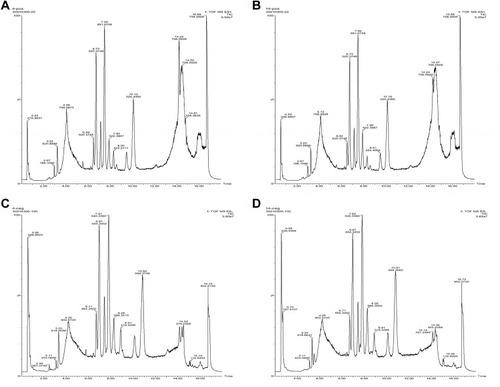
Figure 3 RSD distribution of ions in QC samples. (A) Positive model; (B) negative model.
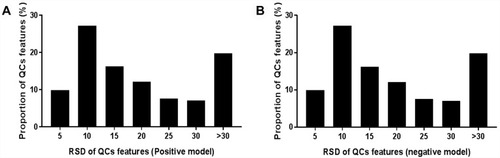
Figure 4 PLS-DA score plots between the control group and HFD group in the positive (A) and negative (B) models; (C) VIP scores representing the most contributing metabolites involved in separation between controls and HFD-induced group.
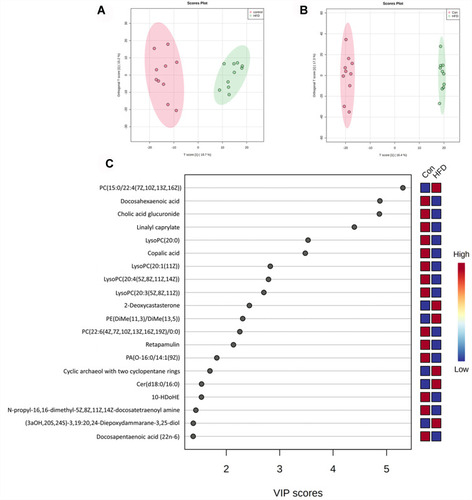
Figure 5 Metabolic characteristics of serum in HFD mice. (A) Volcano plot of Con vs HFD groups in positive (A) and negative (B) models; (C) heat map of normalized metabolites in serum samples. Columns represent the samples (Con and HFD groups), and rows represent the metabolites.
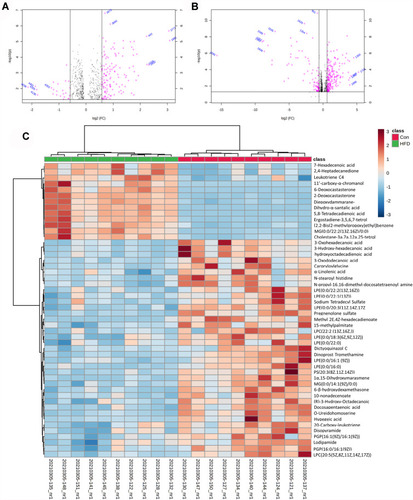
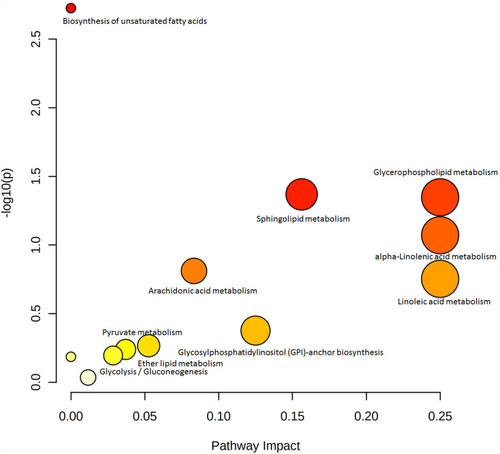
Figure 6 Summary plot for pathway analysis in serum samples.