Figures & data
Table 1 Clinical and Biochemical Characteristics of the Subjects
Figure 1 Correlation analysis of SCFAs, clinical and blood chemistry parameters were displayed in the clustered heatmap. Red is a positive correlation and blue is a negative correlation. The color intensity of the individual rectangles shows the magnitude of the correlation coefficient while the asterisks indicate if the associations are significantly. *P < 0.05; **P < 0.01.
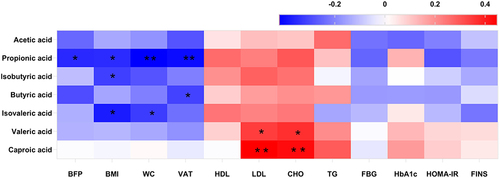
Figure 2 Box-and-whisker plots of α diversity of gut microbiota in fecal samples of participants with visceral obesity (Group A) and non-obesity (Group B). α diversity was estimated using (A) chao1 index as an estimate of community richness, (B) Shannon index as an estimate of community diversity.
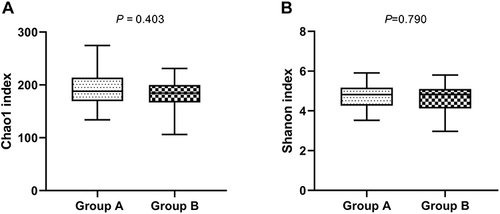
Figure 3 Principal coordinate analysis (PCoA) score plots based on Bray-Curtis distances of fecal microbiota in participants with visceral obesity (Group A) and non-obesity (Group B). P > 0.05.
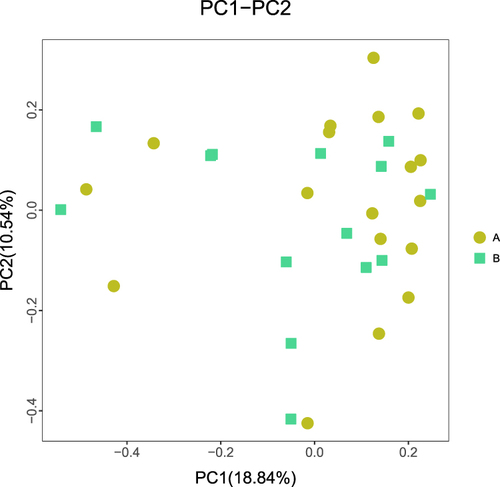
Figure 4 Box-and-whisker plots illustrating the differences of the top 5 bacterial relative abundances in participants with visceral obesity (Group A) and non-obesity (Group B). The median and 95% confidence intervals are shown. *P < 0.05; **P < 0.01.
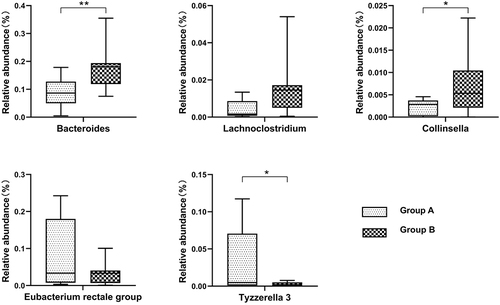
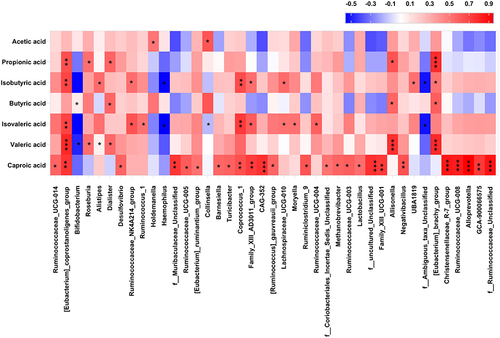
Figure 5 Heatmap displaying Spearman correlation coefficients between bacterial taxa and fecal SCFAs. Red represents a positive correlation and blue indicates a negative correlation. The color intensity of the individual rectangles shows the magnitude of the correlation coefficient while the asterisks indicate if the associations are significantly. *0.01 < P < 0.05; **0.001 < P < 0.01; ***P < 0.001.