Figures & data
Figure 1 Flowchart of study population.
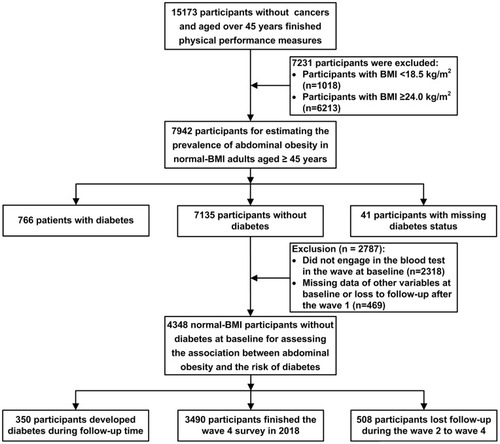
Figure 2 The prevalence of abdominal obesity determined by waist circumference in subgroups of gender and age. (A). Prevalence of abdominal obesity defined by waist circumference in different genders. (B). Prevalence of abdominal obesity defined by waist circumference in different age groups.
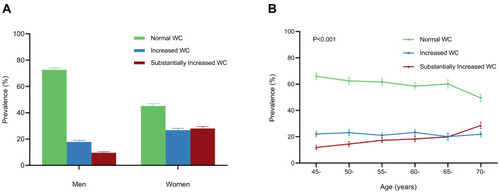
Figure 3 Beeswarm plots of the distribution of waist circumference across the subgroups. (A). Beeswarm plots of the distribution of waist circumference grouped by gender. (B). Beeswarm plots of the distribution of waist circumference in T2DM patients and participants without T2DM.
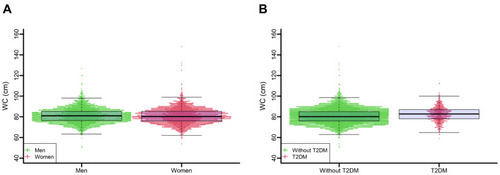
Table 1 Characteristics of the Study Population
Figure 4 The Kaplan-Meier unadjusted survival estimates for different waist circumference groups.
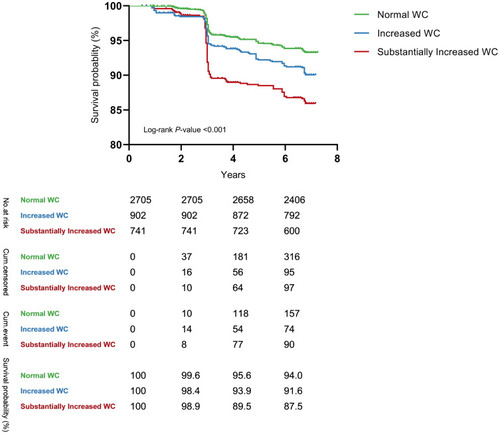
Table 2 Incidence of T2DM and Hazard Ratios (95% CI) of Waist Circumference in the Cox Proportional-Hazards Model
Table 3 Incidence of T2DM and Hazard Ratios (95% CI) of Waist Circumference for Different Subgroups in the Cox Proportional-Hazards Model
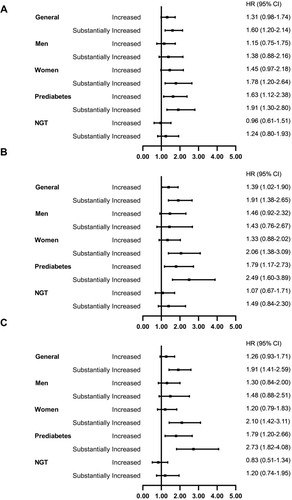
Figure 5 Sensitivity analyses using waist circumference to define abdominal obesity (A). Sensitivity analyses using Time-dependent Cox model. (B). Sensitivity analyses for participants with normal BMI throughout the follow-up (n=3451). (C). Sensitivity analyses for participants with more than 2 years of follow-up (n=4253).