
Figures & data
Figure 1 Study flow diagram.
Notes: aThose patients had a gliclazide MR or glimepiride prescription but had no dispensing history. This may be because they were visitors to the country or followed up in private hospitals or other reasons. We excluded them because we doubt they received any of the study medications and had incomplete files.
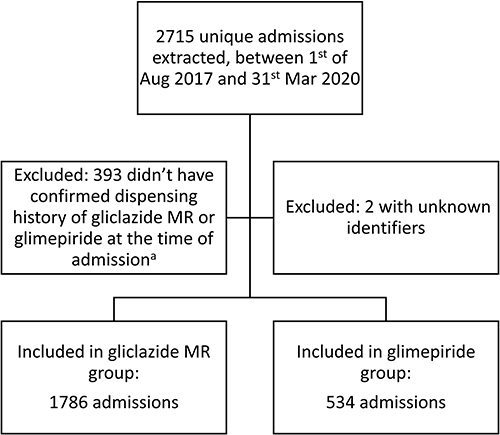
Table 1 Baseline Characteristics of the Study Groups
Table 2 Univariate and Propensity Score-Adjusted Analysis Results
Table 3 Odds Ratio of Gliclazide MR Using Glimepiride as a Baseline in the Study Measures in Patients Using Low Doses
Table 4 Odds Ratio of Gliclazide MR Using Glimepiride as a Baseline in the Study Measures in Patients Using Mod-High Doses