Figures & data
Table 1 Clinical Characteristics of the Study Participants
Table 2 Correlation Coefficients Between the Study Parameters
Table 3 Receiver Operating Characteristic (ROC) Curve Analyses to Compare the Diagnostic Value of Amylase and Other Biomarkers for MetS
Table 4 Logistic Regression Analysis of MetS and Low Total, Pancreatic, and Salivary Amylase Activity
Figure 1 Receiver operating characteristic (ROC) curve analyses were used to evaluate the diagnostic value of amylase for MetS. ROC curve analyses the diagnostic value of serum total amylase, serum salivary amylase, and pancreatic amylase (T-, S-, P-AMY) and other markers for MetS.
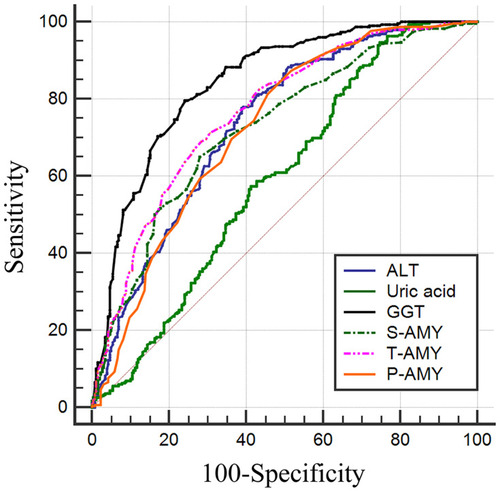
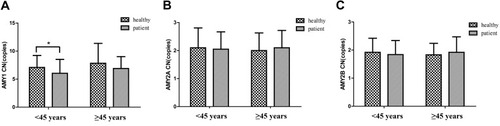
Figure 2 Mean AMY1/2A/2B gene copy number (CN) in different age groups. (A) The mean AMY1 gene CNs were compared between patients and healthy controls in different age groups (age <45 y and ≥45 y); (B) CNs of genes AMY2A and (C) AMY2B were compared between patients and healthy controls in different age groups (age <45 y and ≥45 y). The Asterisk indicates a significant difference (p < 0.05).