
Figures & data
Table 1 Comparison Between the Studied Groups Regarding the Clinical Data
Figure 1 Median nerve CSA in the studied groups.
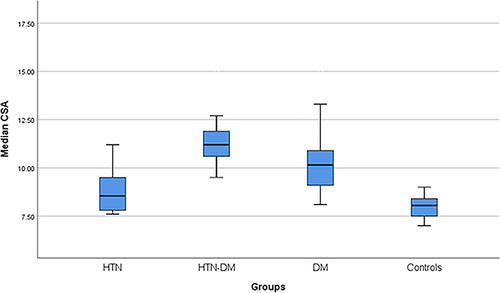
Figure 2 ROC curve for median nerve CSA distinguishes patients with peripheral neuropathy in HTN + DM group.
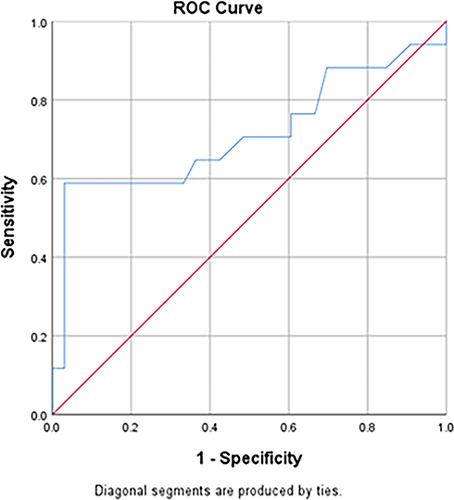
Figure 3 ROC curve for median nerve CSA distinguishes patients with peripheral neuropathy in DM group.
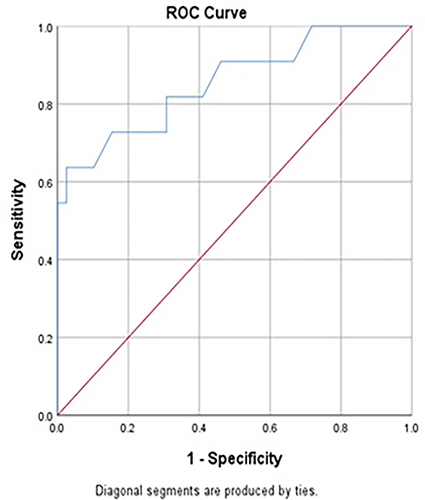
Table 2 Correlation Between Median Nerve CSA and Clinical Data in the Studied Patients