
Figures & data
Figure 1 Gpr75 KO mice had low body fat and improved glucose tolerance in our high-throughput screen (HTS). (A) Histogram of normalized % body fat (n%BF) values for the 3650 KO lines maintained on chow diet that were included in our HTS. Body composition analyses performed by DXA on 14-week-old mice were used to calculate n%BF for the cohort from each individual KO line. Solid points indicate actual numbers of KO lines within that mean ± 2.5% value of n%BF. Curved line shows the calculated curve. The range for 1 and 2 SD from the population mean is indicated by lines located below the curve, and the mean n%BF values for the Gpr75 KO and HET mice from the HTS cohort are indicated by arrows above the curve. (B) Histogram of n%BF values for the 2488 KO lines maintained on HFD that were included in our HTS. Body composition analyses performed by QMR on 11-week-old mice were used to calculate n%BF for the cohort from each individual KO line. The histogram is organized as in (A) above. (C) Histogram of normalized glucose AUC values calculated from OGTTs performed on 11-week-old mice from 2987 of the chow fed cohorts evaluated in our HTS. The histogram is organized as in (A) above. (D) Histogram of normalized glucose AUC values calculated from OGTTs performed on 14-week-old mice from all 2490 of the HFD cohorts evaluated in our HTS. The histogram is organized as in (A) above.
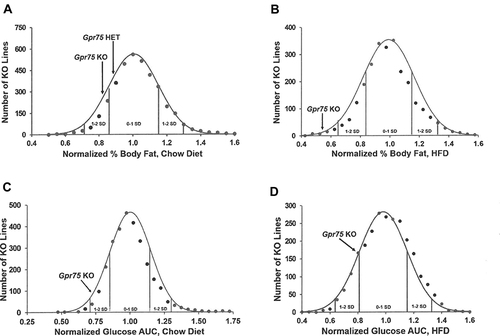
Table 1 Normalized Body Composition Data for Gpr75 KO Mice
Figure 2 Body composition of Gpr75 KO mice and their WT littermates. (A) Body composition data were normalized and combined from all 118 Gpr75 KO mice (54 female, 64 male) and all 103 WT littermate mice (47 female, 56 male) that were weighed and analyzed by QMR at 11–24 weeks of age (Supplementary Table 1). (A) body weight; (B) body fat; (C) % body fat; and (D) lean body mass. †Statistical analysis by Mann–Whitney test.
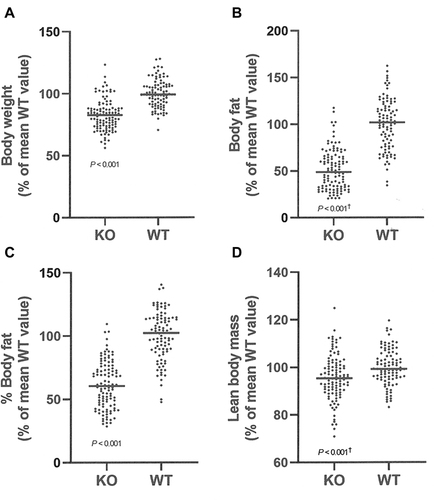
Figure 3 Gpr75 KO mice exhibit low body fat early in life: time course data. Body fat was measured by QMR at multiple timepoints between 3 weeks of age (weaning) and 15 weeks of age on HFD-fed (A) female Gpr75 KO mice (n=7) and their WT littermates (n=11), and (B) male Gpr75 KO mice (n=12) and their WT littermates (n=10). KO mice different from WT mice of the same age and sex, *P < 0.05, **P < 0.01, ***P < 0.001.
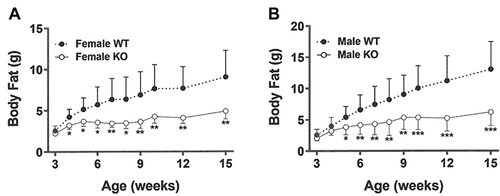
Figure 4 Gpr75 KO and WT mice exhibit comparable activity early in life as low body fat phenotype is developing. Individually housed Gpr75 KO (9 female, 9 male) and WT (9 female, 9 male) mice were studied for 27 days starting immediately after weaning onto HFD. Change (∆) in (A) body weight and (B) body fat during this 27-day interval. Mean 12-hour (C) dark cycle and (D) light cycle circadian locomotor activity levels in all mice over this 27-day period, based on data from 22 full 12-hour dark cycles and 19 full 12-hour light cycles. KO mice different from WT mice of the same age and sex, *P < 0.05, **P < 0.01.
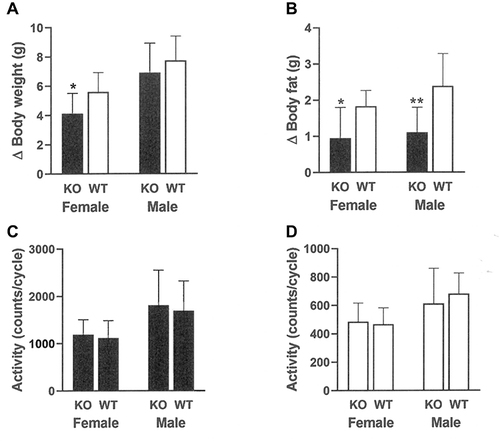
Figure 5 Gpr75 KO and WT mice exhibit comparable energy expenditure and activity levels early in life as low body fat phenotype is developing. Individually housed Gpr75 KO (8 male) and WT (8 male) mice were studied in Oxymax indirect calorimetry chambers for two full 12-hour dark cycles and one full 12-hour light cycle during the 27-day interval starting immediately after weaning onto HFD. Parameters measured include (A) Oxygen consumption (VO2), (B) respiratory exchange ratio (RER), (C) energy expenditure (EE), and (D) activity levels.
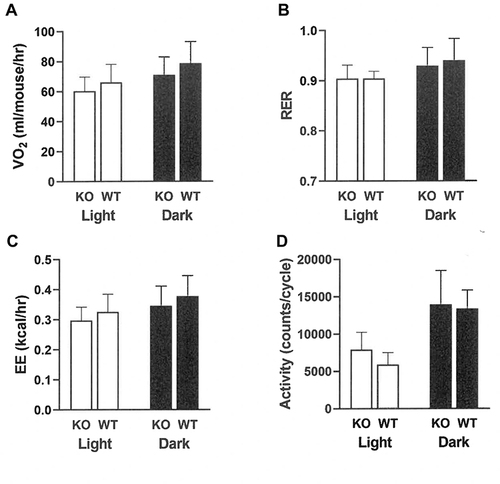
Figure 6 Decreased food intake by female and male Gpr75 KO mice early in life as low body fat phenotype is developing. Gpr75 KO mice (22 female, 22 male) and WT mice (19 female, 21 male) group housed by sex and genotype (2–3 mice/cage) were studied for 7 days starting immediately after weaning onto HFD. Change (∆) in (A) female body weight, (B) female body fat, (C) male body weight, and (D) male body fat over these 7 days. Daily food intake in grams (g) for female (E) and male (F) mice during the 5 intervals where food intake was measured, calculated as mean food intake/mouse for each cage of group-housed KO mice (16 cages, 8 female and 8 male) and WT mice (14 cages, 7 female and 7 male). KO mice different from WT mice, *P < 0.05, **P < 0.01.
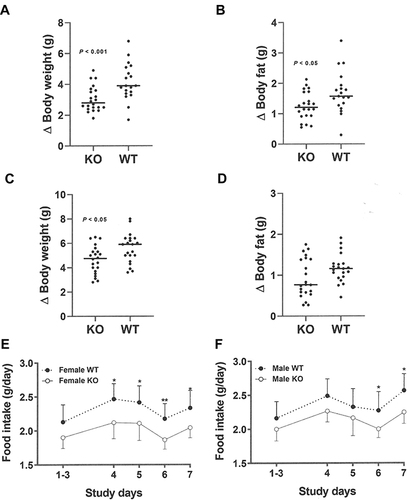
Figure 7 Decreased food intake by Gpr75 KO mice early in life as low body fat phenotype is developing: pooled female and male data. Gpr75 KO mice (22 female, 22 male) and WT mice (19 female, 21 male) were group housed by sex and genotype (2–3 mice/cage) and then studied for 7 days starting immediately after weaning onto HFD. Change (∆) in (A) body weight and (B) body fat during this 7-day interval. (C) Mean food intake in grams (g) during this 7-day interval, calculated as mean food intake/mouse for each cage of group-housed KO mice (16 cages, 8 female and 8 male) and WT mice (14 cages, 7 female and 7 male).
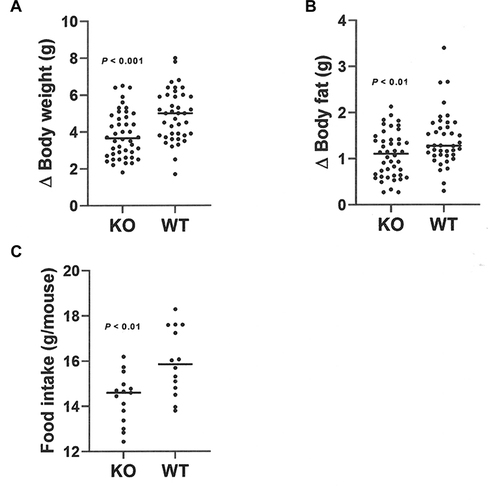
Figure 8 Improved glucose homeostasis in adult Gpr75 KO mice. (A) Glucose excursions, and (B) 0-minute and 30-minute insulin levels, from OGTTs performed on HFD-fed female Gpr75 KO mice (n=28) and their WT littermates (n=20) at 24–30 weeks of age. (C) Glucose excursions, and (D) 0-minute and 30-minute insulin levels, from OGTTs performed on HFD-fed male Gpr75 KO mice (n=31) and their WT littermates (n=25) at 24–36 weeks of age. Log-transformed (E) HOMA and (F) composite insulin sensitivity index (ISI) values for all mice; higher ISI values indicate increased insulin sensitivity. KO mice different from WT mice, *P < 0.05, ***P < 0.001.
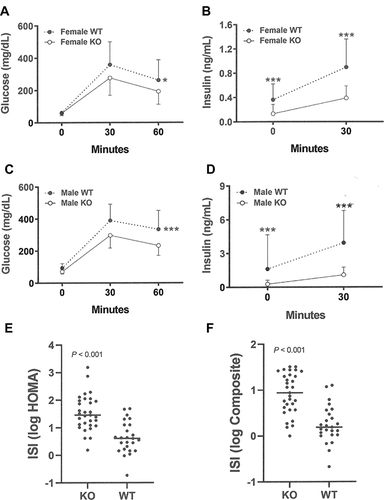
Table 2 Serum Chemistries of Gpr75 KO Mice and Their WT Littermates