Figures & data
Table 1 Body mass index, glycemic control, serum lipid profiles, blood pressure, and drugs at baseline and 12 months in all patients (n = 124)
Table 2 Baseline characteristics of patients by level of UAE (n = 124)
Table 3 Differences of dietary assessment, BMI, HbA1c, and HOMA-IR in less strict and strict CARD patients
Figure 1 Individual changes in UAE (mg/g Cr) in (A) normoalbuminuric patients (n = 68), (B) microalbuminuric patients (n = 50), and (C) macroalbuminuric patients (n = 6), over 12 months. Dot lines show borderlines between normoalbuminuria and microalbuminuria (30 mg/g Cr) in (A and B), and between microalbuminuria and macroalbuminuria (300 mg/g Cr) in (B and C).
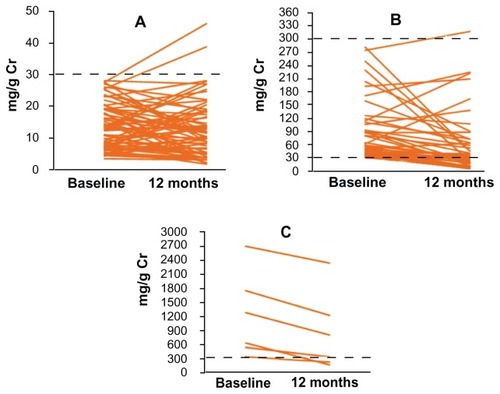
Table 4 Changes in UAE, BMI, glycemic control, fasting serum insulin, serum lipid profiles, blood pressure, and eGFR over 12 months
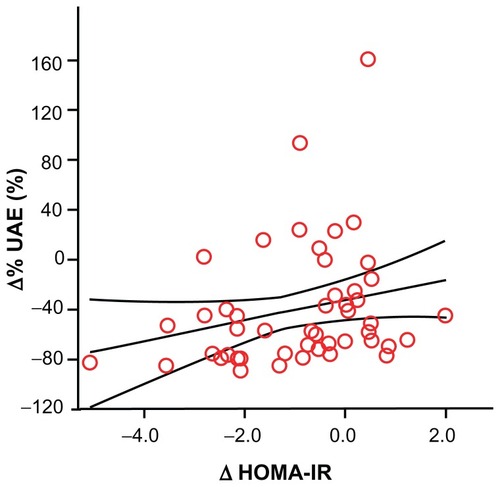
Figure 2 Correlation of Δ% UAE with Δ HOMA-IR in the 50 microalbuminuric patients.
Abbreviations: Δ% UAE, percentage change in urinary albumin secretion; HOMA-IR, homeostasis model of assessment of insulin resistance.