
Figures & data
Figure 1 Flow chart of the study population enrollment.
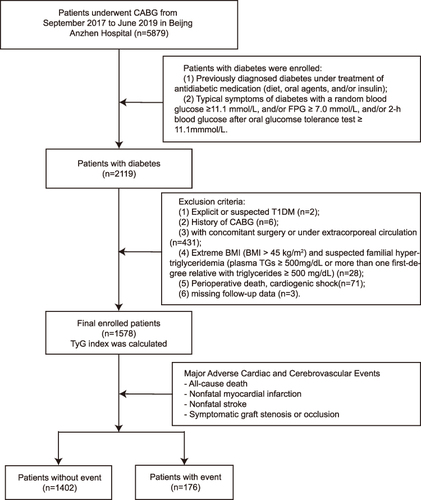
Table 1 Baseline Clinical and Laboratory Characteristics and of the Study Patients Stratified by the Tertiles of TyG Index
Table 2 Baseline TyG Index and Prediction of Cardiovascular and Cerebrovascular Events
Figure 2 The TyG index and risk: Kaplan–Meier curves for the incidences of the primary endpoint (A), symptomatic graft failure (B), all-cause death (C), non-fatal MI (D), and non-fatal stroke (E) among the three study groups based on the TyG index tertiles.
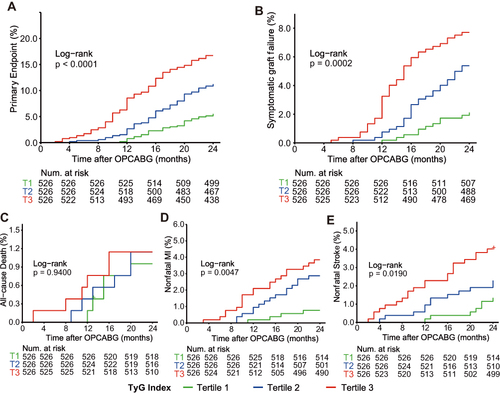
Table 3 Relationship Between the Incidence of the Primary Endpoint and the TyG Index Expressed as a Continuous Variable
Table 4 Relationship Between the Incidence of the Primary Endpoint and the TyG Index Expressed as a Categorical Variable