
Figures & data
Figure 1 PRISMA flow diagram.
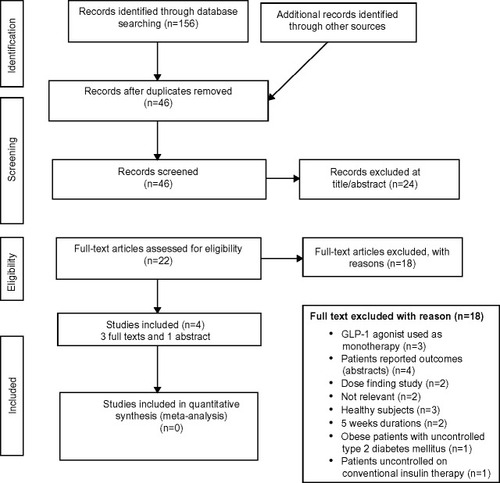
Table 1 Characteristics of the included studies
Figure 2 Risk of bias.
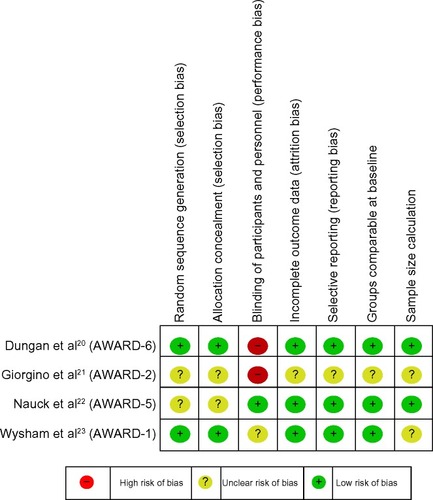
Figure 3 Mean change in HbA1c from baseline to follow-up (AWARD 1 and 2).
Abbreviations: LS, least square; HbA1c, glycated hemoglobin; AWARD, Assessment of Weekly Administration of Dulaglutide in Diabetes; Dula, dulaglutide; Exe, exenatide; P, placebo.
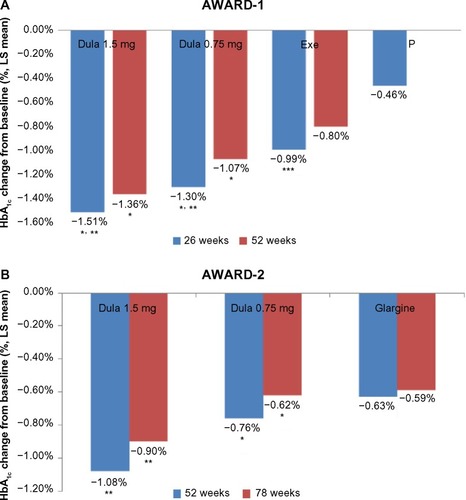
Figure 4 Mean change in HbA1c from baseline to follow-up (AWARD 5 and 6).
Abbreviations: LS, least square; HbA1c, glycated hemoglobin; AWARD, Assessment of Weekly Administration of Dulaglutide in Diabetes; Dula, dulaglutide; P, placebo; Sita, sitagliptin; Lira, liraglutide.
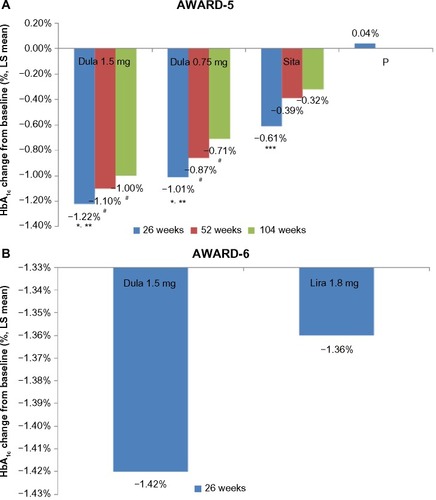
Figure 5 Proportion of patients achieving a target HbA1c level of <7% and ≤6.5% (AWARD 1 and 2).
Abbreviations: AWARD, Assessment of Weekly Administration of Dulaglutide in Diabetes; HbA1c, glycated hemoglobin; Dula, dulaglutide; P, placebo; Exe, exenatide; Glar, glargine.
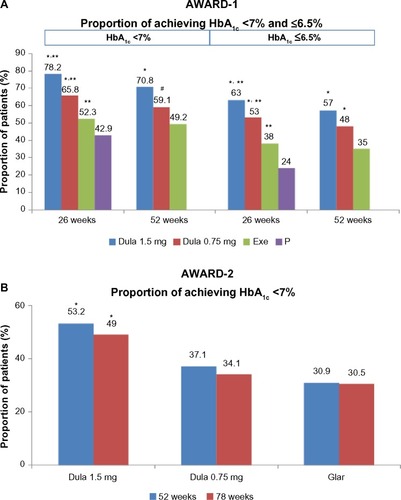
Table 2 Changes in HbA1c, weight and BMI
Figure 6 (A) and (B) Proportion of patients achieving a target HbA1c level of <7% and ≤6.5% (AWARD 5 and 6).
Abbreviations: AWARD, Assessment of Weekly Administration of Dulaglutide in Diabetes; HbA1c, glycated hemoglobin; Dula, dulaglutide; P, placebo; Sita, sitagliptin; Lira, liraglutide.
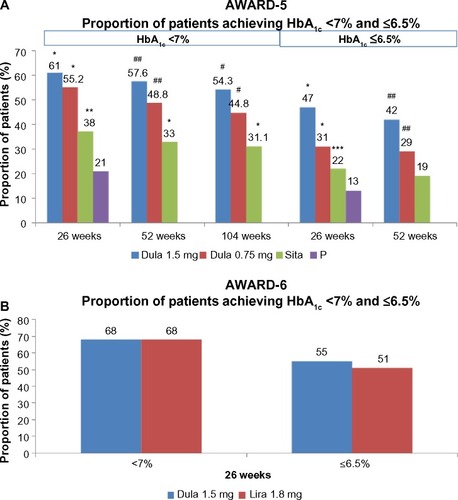
Figure 7 Mean change in weight (kg) from baseline to follow-up (AWARD 1 and 2).
Abbreviations: LS, least square; AWARD, Assessment of Weekly Administration of Dulaglutide in Diabetes; Dula, dulaglutide; Exe, exenatide; P, placebo.
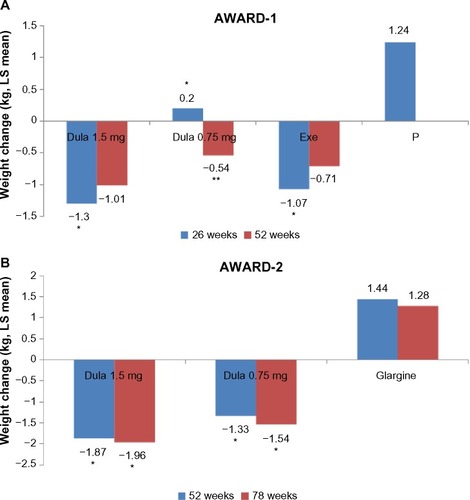
Figure 8 Mean change in weight (kg) from baseline to follow-up (AWARD 5 and 6).
Abbreviations: LS, least square; AWARD, Assessment of Weekly Administration of Dulaglutide in Diabetes; Dula, dulaglutide; P, placebo; Sita, sitagliptin; Lira, liraglutide.
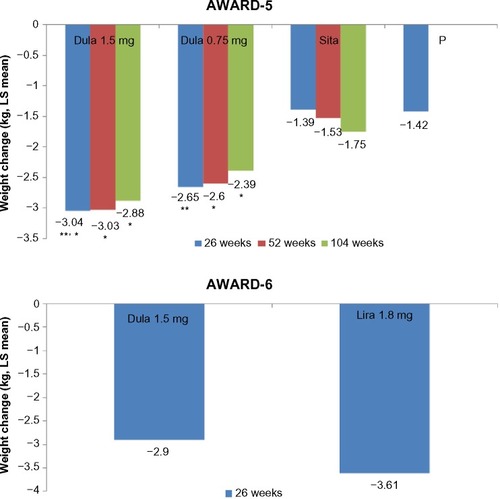
Table 3 Fasting plasma glucose, postprandial plasma glucose, and blood pressure
Table 4 Adverse events, withdrawals, and hypoglycemia
Table S1 Search strategy: MEDLINE