
Figures & data
Table 1 Characteristics of the Patients (N=612)
Table 2 Parameters Measured in Patients
Table 3 Family History of DM and FBS Level
Figure 1 Prevalence of pre-DM and DM in relation to family history and consanguinity. The figure shows the percentage of subjects with prediabetes and diabetes in relation to the number of first-degree relatives with diabetes in addition to the presence of consanguinity (p value 0.031).
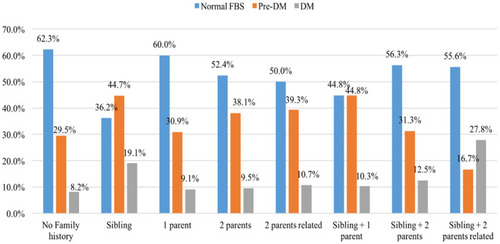
Table 4 Univariate Analysis Showing Risk Factors for Pre-DM and DM*
Figure 2 Waist circumference was significantly correlated with BMI r= 0.65 (p value <0.001).
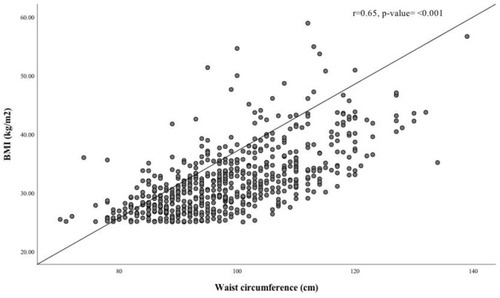
Table 5 Multivariate Analysis of Risk Factors for Pre-DM and DM