
Figures & data
Table 1 Clinical Characteristics of T2DM Patients with and without Visceral Obesity
Table 2 Comparison of Thyroid Indicators of T2DM Patients with and without Visceral Obesity
Table 3 Association of TPOAb and VFA with Other Indicators in T2DM Patients
Figure 1 Association between TPOAb titer and VFA. Linear correlation analysis showed an obviously positive correlation of VFA with TPOAb titer in T2DM patients (r = 0.175, p < 0.001).
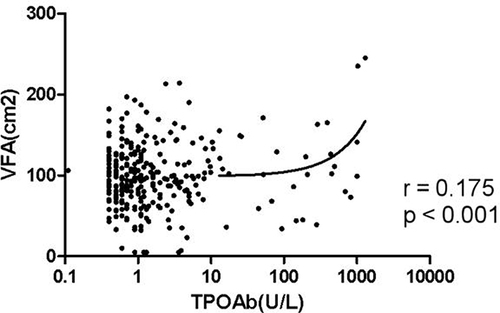
Figure 2 Association between TPOAb titer and SFA. Linear correlation analysis showed an obviously positive correlation of SFA with TPOAb titer in T2DM patients (r = 0.184, p < 0.001).
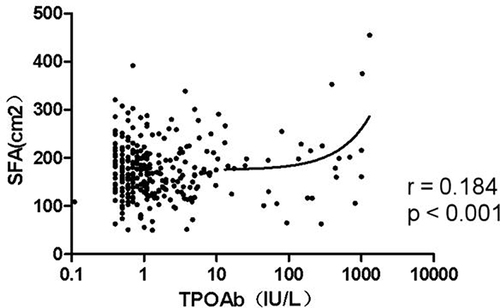
Table 4 Association of the TPOAb with Visceral Fat Area: Binary Logistic Regression