Figures & data
Figure 1 The effect of exercise on mice body weight. (A) The analysis of changes of body weight during the intervention, (B) percentage of the body weight gain, (C) Lee index, (D) eWAT mass, (E) the ratio of eWAT mass and body weight, and (F) the fasting blood glucose in the different groups. The results were represented as mean±SEM (n=6 each group). *P <0.05, **P <0.01, ****P<0.0001, compared to HFD + Sed group; #P<0.05, ##P<0.01, ###P<0.001, ####P<0.0001 compared to SD + Sed group.
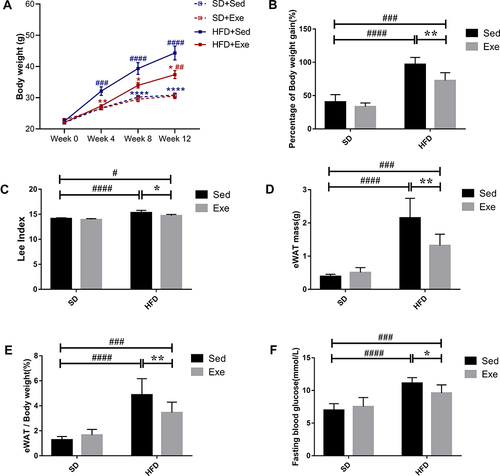
Figure 2 The effects of exercise on diversities of gut microbiota in different groups. (A) Alpha diversity after activity protocol and diet. Chao1 index was used to estimate the community richness of the gut microbiota. (B) Shannon index, was used to assess the Alpha diversity. (C) PCA at the OTU level. The results were represented as mean±SEM (n=5 or 6 each group). **P <0.01, compared to HFD + Sed group; #P<0.05, ##P<0.01, ####P<0.0001 compared to SD + Sed group.
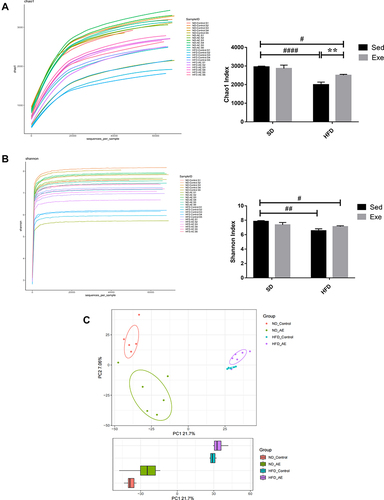
Figure 3 The percent of community abundance on the phylum levels. (A) Barplot chart of relative abundances of gut microbiota at the phylum levels. (B–D) Relative abundance of Bacteroidetes, Firmicutes and their ratio in the different groups. (E) Relative abundance of Verrucomicrobia. The results were represented as mean±SEM (n=5 or 6 each group). *P <0.05, compared to HFD + Sed group; ##P<0.01, ###P<0.001, compared to SD + Sed group.
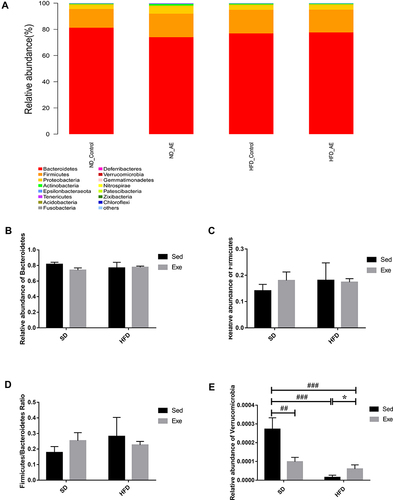
Figure 4 Percentage of community abundance at the family and genus levels. (A) Barplot chart of the relative abundances of gut microbiota at the family levels. (B) Heatmap of relative abundance at genus levels in different groups. (C–E) Relative abundance of Bifidobacteriaceae, Akkermansia and Ruminococcaceae_UCG-014 in different groups. The results were represented as mean±SEM (n=5 or 6 each group). **P <0.01, compared to HFD + Sed group; #P<0.05, ##P<0.01, ###P<0.001, ####P<0.0001 compared to SD + Sed group.
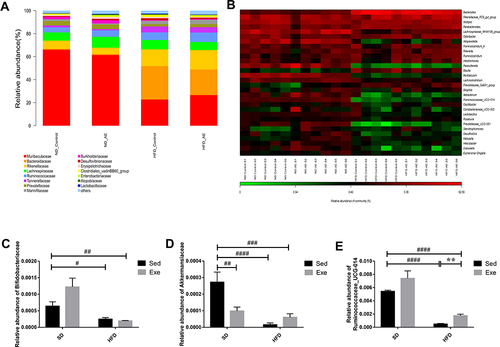
Figure 5 LDA effect size analysis. The composition of distinct species in the communities (SD + Sed, SD + Exe,HFD + Sed and HFD + Exe).
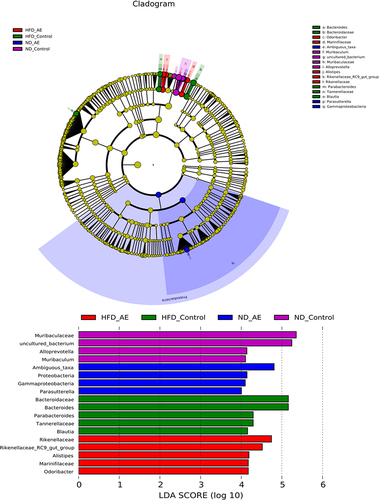
Figure 6 H&E and PAS staining sections of the colon tissues of mice. (A)The effect of moderate exercise on the pathological changes of the colon on mice. (B and C) The effect of moderate exercise on the GCs changes of the colon in the different groups. Scale bar: 100μm. The results were represented as mean±SEM (n= 3 each group). *P <0.05, compared to HFD + Sed group; #P<0.05, ###P<0.001, compared to SD + Sed group.
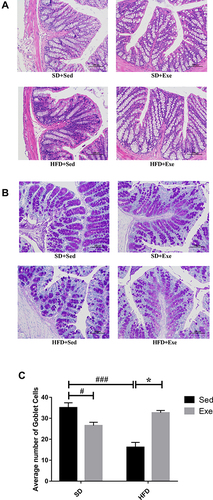
Figure 7 Expressions of TJs in mice colon. (A) The protein expressions of occludin and (B) ZO-1 in the colon were detected by immunoblotting. The results were represented as mean±SEM (n= 6 each group). *P <0.05, **P <0.01, ***P<0.001, compared to HFD + Sed group; #P<0.05, compared to SD + Sed group.
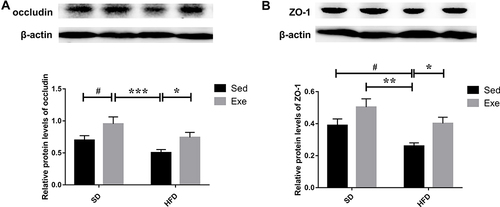
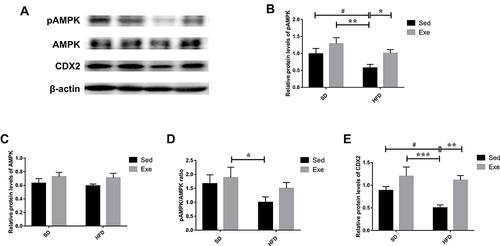
Figure 8 The levels of AMPK/CDX2 signaling pathway proteins in the mice colon. (A–D) The protein levels of pAMPK, AMPK and their ratio. (A and E) The levels of CDX2 in the colon were detected by immunoblotting. The results were represented as mean±SEM (n= 6 each group). *P <0.05, **P <0.01, ***P<0.001, compared to HFD + Sed group; #P<0.05, compared to SD + Sed group.